Your content goes here. Edit or remove this text inline or in the module Content settings. You can also style every aspect of this content in the module Design settings and even apply custom CSS to this text in the module Advanced settings.
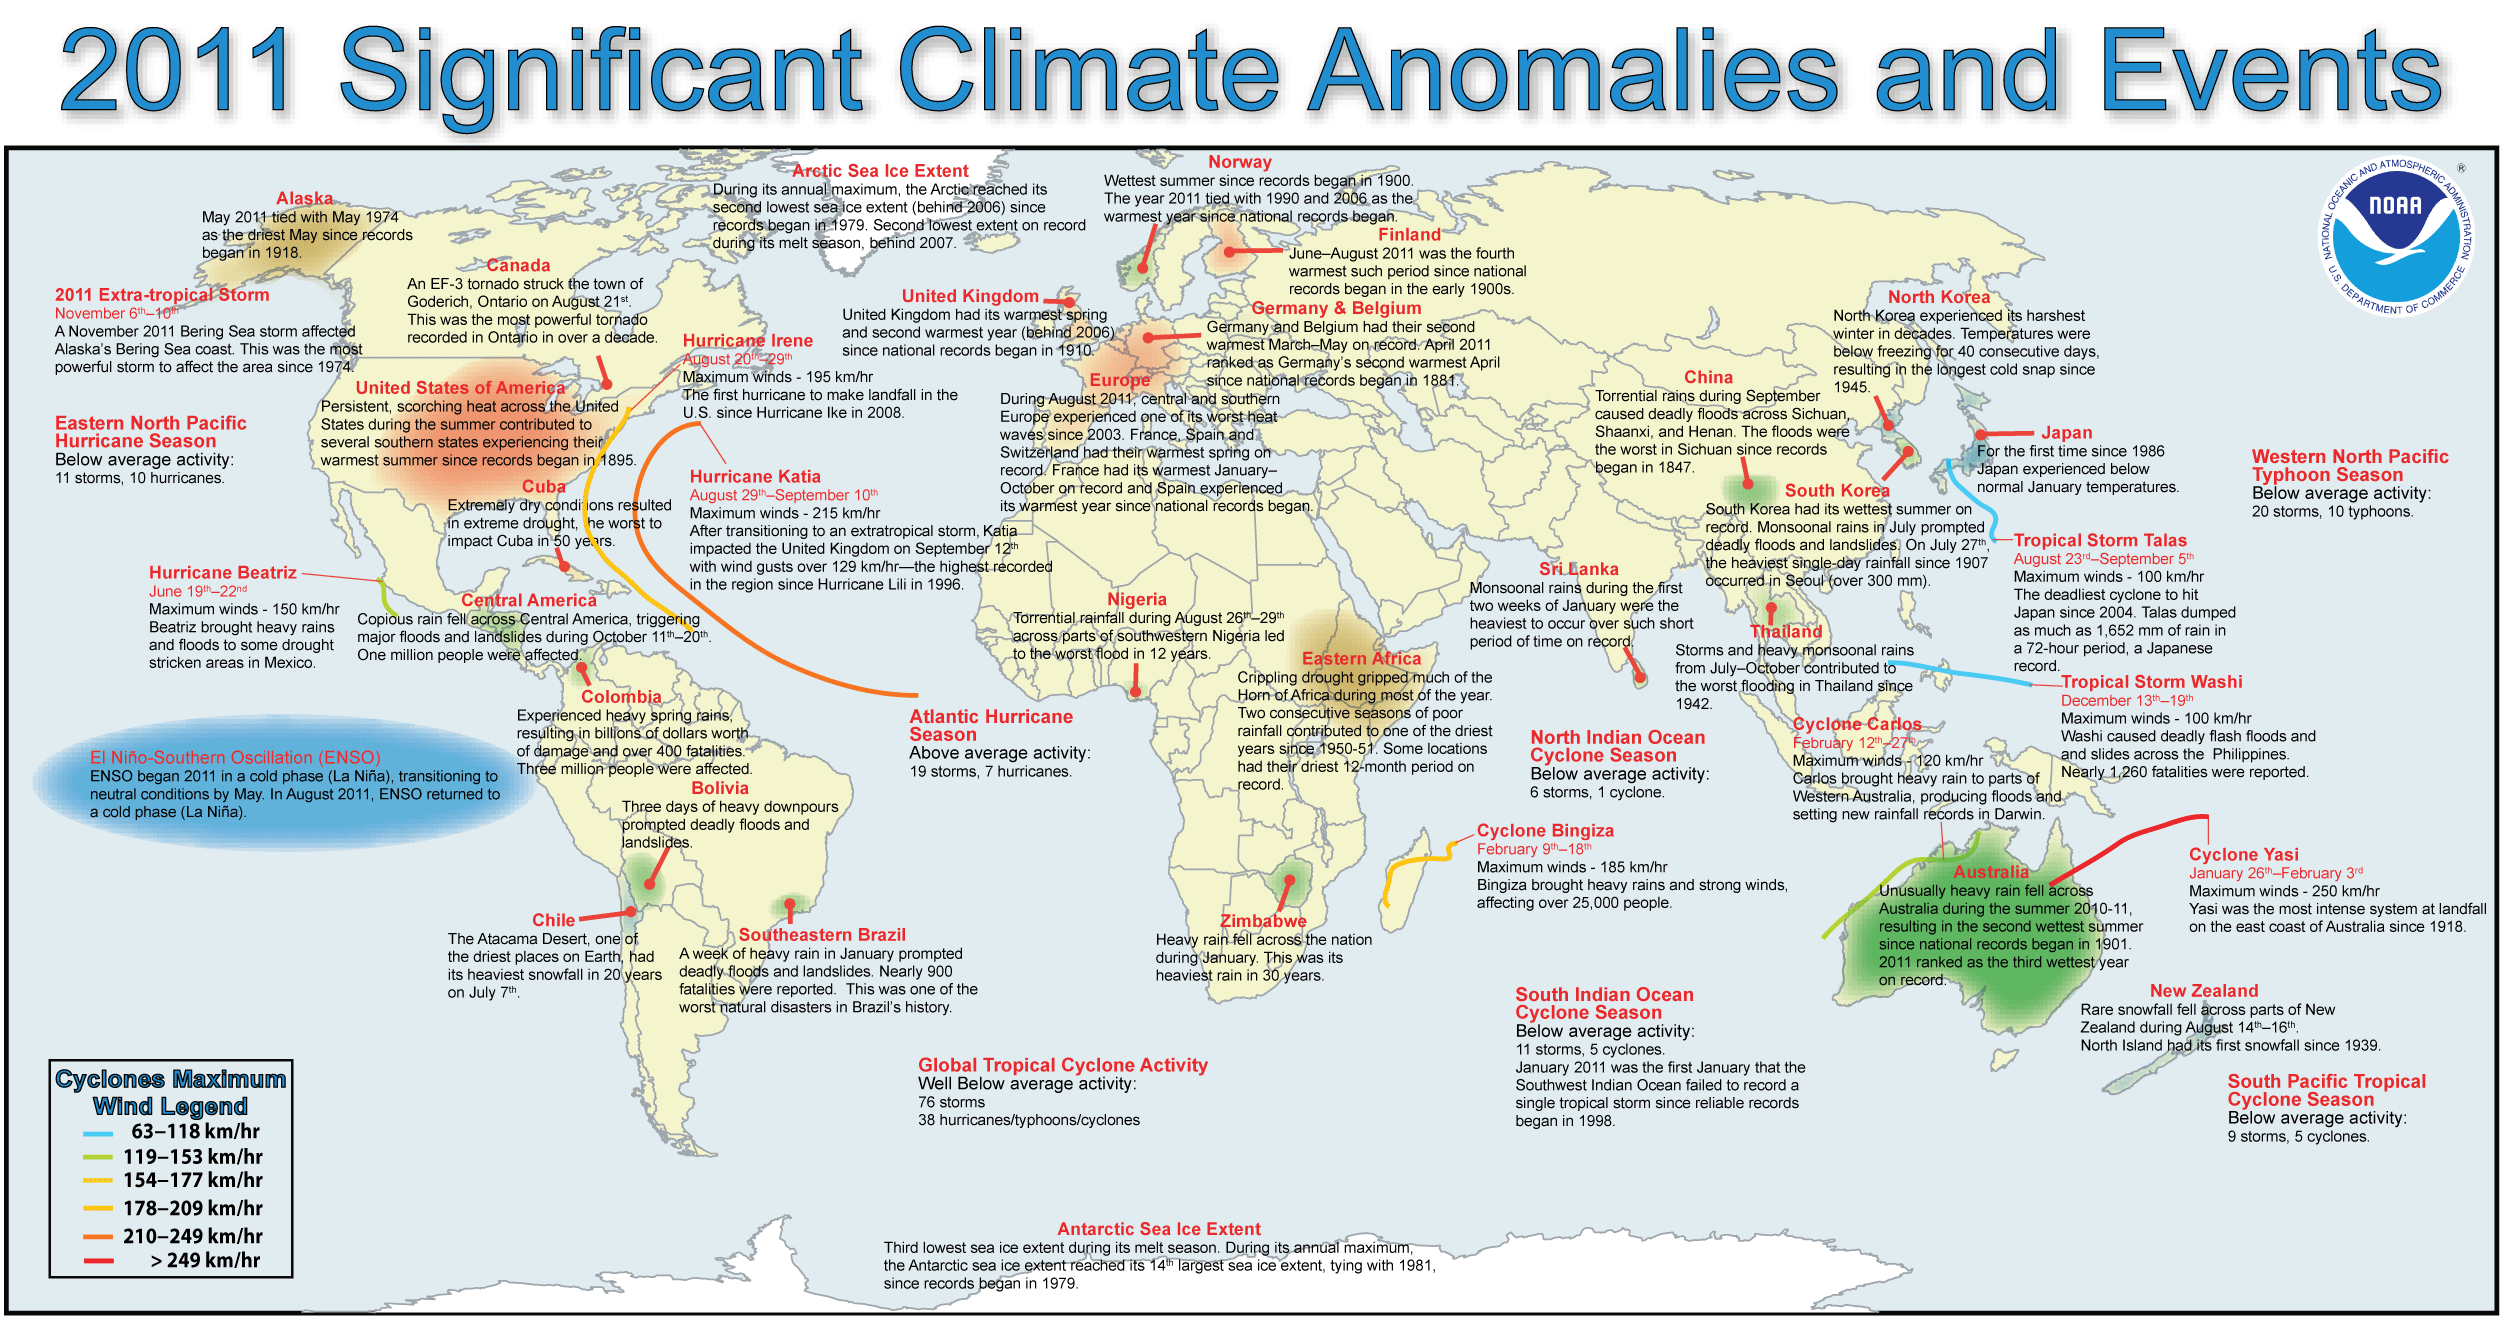
Top Ten Global Weather/Climate Events for 2011; State of the Climate Report; Global Precipitation
Top Ten Global Weather/Climate Events for 2011
The following table list the top ten global weather/climate events of 2011. These events are listed according to their overall rank, as voted on by a panel of weather/climate experts. For additional information on these and other significant 2011 climate events, please visit NCDC’s Top Ten Global Events webpage.
| Rank | Event | When Occurred |
|---|---|---|
| 1 | East Africa Drought | Ongoing |
| 2 | Thailand Flooding | July–October |
| 3 | Eastern Australia Flooding | December 2010–February 2011 Austral Summer |
| 4 | Consecutive La Niña Events | Throughout 2011 |
| 5 | Brazil Flash Floods | January 6th–12th |
| 6 | Tropical Storm Washi (Sendong) | December 16th–17th |
| 7 | Arctic Sea Ice Extent | Throughout 2011 |
| 8 | Colombia Rainfall | March–May |
| 9 | Mexico Drought | Throughout 2011 |
| 10 | European Drought | September–November |
State of the Climate Report:
Source: https://www.ncdc.noaa.gov/sotc/global/2011/13
Global Highlights
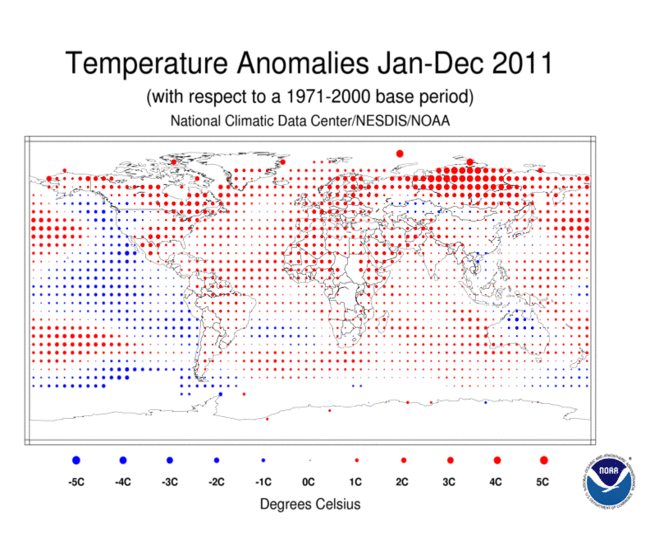
- This year tied 1997 as the 11th warmest year since records began in 1880. The annual global combined land and ocean surface temperature was 0.51°C (0.92°F) above the 20th century average of 13.9°C (57.0°F). This marks the 35th consecutive year, since 1976, that the yearly global temperature was above average. The warmest years on record were 2010 and 2005, which were 0.64°C (1.15°F) above average.
- Separately, the 2011 global average land surface temperature was 0.8°C (1.49°F) above the 20th century average of 8.5°C (47.3°F) and ranked as the eighth warmest on record. The 2011 global average ocean temperature was 0.40°C (0.72°F) above the 20th century average of 16.1°C (60.9°F) and ranked as the 11th warmest on record.
- La Niña, which is defined by cooler-than-normal waters in the eastern and central equatorial Pacific Ocean that affects weather patterns around the globe, was present during much of 2011. A relatively strong phase of La Niña opened the year, then dissipated in the spring before re-emerging in October and lasting through the end of the year. When compared to previous La Niña years, the 2011 global surface temperature was the warmest observed during such a year.
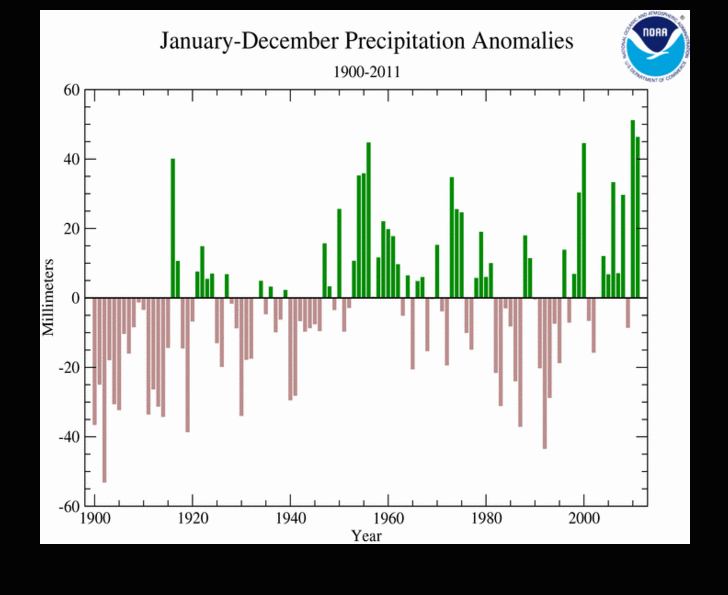
- The 2011 globally-averaged precipitation over land was the second wettest year on record, behind 2010. Precipitation varied greatly across the globe. La Niña contributed to severe drought in the Horn of Africa and to Australia?s third wettest year in its 112-year period of record.
Annual Global Temperature Anomalies (1950-2011)
Source: https://www.ncdc.noaa.gov/sotc/global/2011/13
January–December 2011 Blended Land and Sea
Surface Temperature Anomalies in degrees Celsius
Source: https://www.ncdc.noaa.gov/sotc/global/2011/13
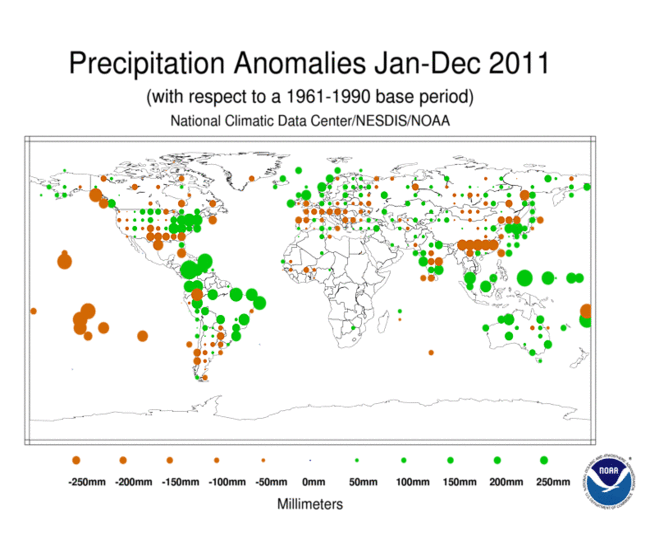
Global Precipitation
Global precipitation over land in 2011 was well above the 1961–1990 average for the second year in a row, ranking as the second wettest year on record, behind 2010. Precipitation anomalies were variable across the globe. It was wetter than normal across much of the northeastern United States, Central America, much of coastal South America, Australia, and northwestern China. It was particularly drier than normal in far southwestern Canada, the south central United States, northern Mexico, southern and northeastern China, Mongolia, Hawaii, and French Polynesia and Kiribati in the South Pacific Ocean.


