Attribution
Climate attribution literally has to do with what causes something, or “to explain by indicating a cause”. With regard to climate and weather it is important to understand the differences between what attribution can be assigned to climate and/or weather events at a given moment, or over a span of time. The longer the span of time, the more the attribution moves away from weather and towards climate, and vice versa.
1 : to explain by indicating a cause <attributed his success to his coach>
2 a : to regard as a characteristic of a person or thing b : to reckon as made or originated in an indicated fashion <attributed the invention to a Russian> c : classify, designate
Source: https://www.merriam-webster.com/dictionary/attributing
In order to understand how one finds attribution, one needs to understand the process used to identify attribution.
Global and continental temperature change
Source: IPCC AR4 WG1
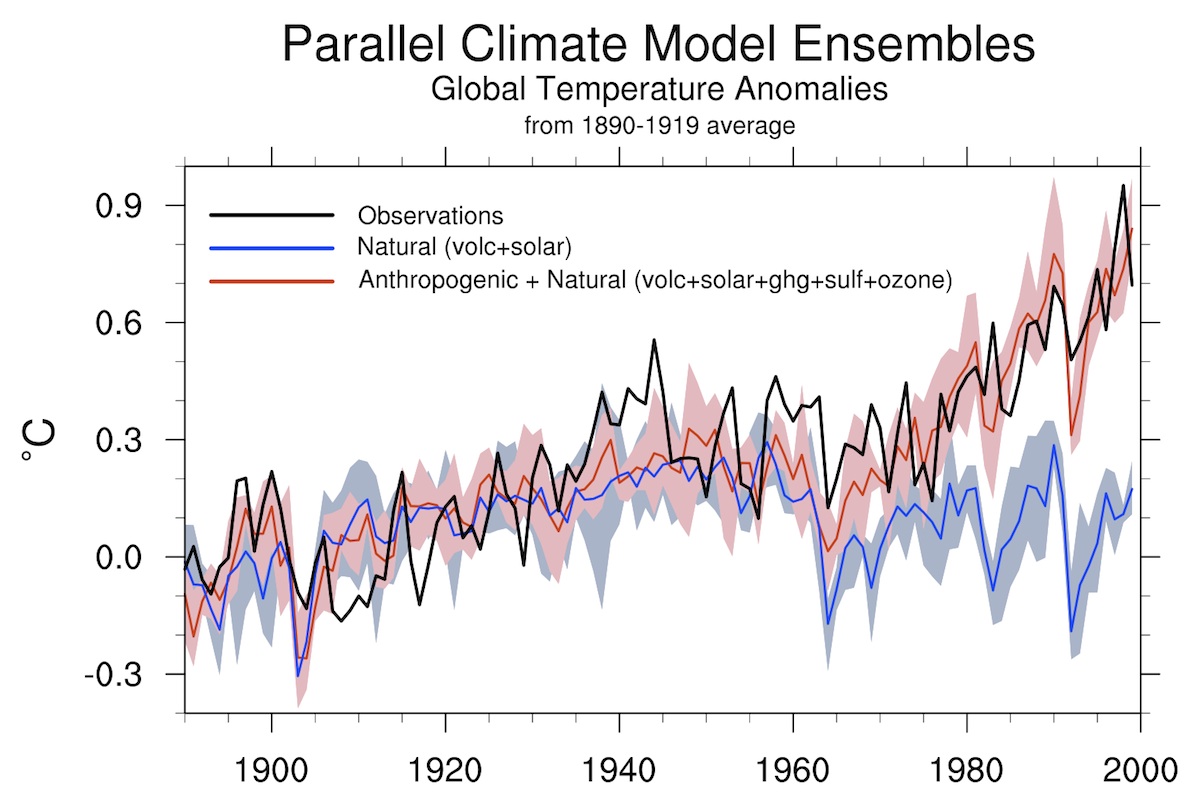
The NCAR/UCAR Chart
If you click on the chart in the upper right corner of this page you can see that it examines five major factors that contribute to climate change. These are broken down into two categories including natural and anthropogenic (human-caused):
Natural
Anthropogenic
- Changes in Greenhouse Gas (GHG) Levels in the Atmospheric Composition
- Changes in Sulfate Levels
- Changes in Ozone Levels
- The blue line indicates the expected temperature including solar and volcanic influences as well as natural (pre-industrial) levels of GHG’s. The shaded (light-blue-gray) area surrounding the line is the error bar range.
- The red line indicates the expected temperature including natural solar and volcanic influences, natural GHG levels, and adds changes to the atmospheric composition of GHG’s that help warm the planet and industrial aerosols that contribute to cooling the planet.
- The black line represents the observed temperatures during the modern instrumental record.
The graph clearly shows that the observations are closely matching the red line climate model and that the red line and the black line are clearly above the temperatures of the blue line indicating expected natural temperatures modeled without the additional industrial forcings.
Simplified, it looks like this:
“doing it properly takes time and effort. … You need to understand what is happening, you need to have a model of some sort of the system and you need to show that of the possible causes, one or more have fingerprints that fit the observations.”
Source: Gavin Schmidt NASA/GISS – RealClimate
One needs to identify what a specific change is expected to do. Then one isolates how that works with an experiment that can be repeated to see how robust conclusions are. If one can reasonably attain an expected effect from a cause, then one has a reasonable idea of attribution for the effect. In other words, one can see that a certain cause results in a certain effect. The Cause/Effect Relationship.
In the climate system, models of various types are applied to the multitude of known cause/effect relationships. This helps separate the signal of the effect from the noise of natural variation, and gives a clearer picture of what can reasonably be attributed to the causes in the models. Then you simply examine the changes in the real world to see if the expected effects are actually happening!
If it is happening then you have a good idea of the attribution.
In other words, if the expected effects are occurring in the observations, and the models indicate that those effects would not be there if the new tested/modeled causes were missing, that helps confirm that the modeled attribution is telling you with a degree of accuracy what the cause/effect relationship is. Thus the signal is identifiable beyond the noise.
Once you have a good idea of what causes certain effects, you can then examine real world circumstances and apply the findings to identify the cause and effect relationship. If the effect is there, and there are no other causes that can explain it, then what is left is likely the attribution of the cause/effect relationship. This is the logic of ‘Occam’s/Ockham’s Razor’.
Occam’s/Ockham’s Razor
entia non sunt multiplicanda praeter necessitatem
Entities should not be multiplied more than necessary. Said another way, reduce to the essentials to clear away the noise and examine what is left. Of course there are many other ways to apply the Razor, but this is good for our application in consideration of climate and attribution. That said, climate attribution is sophisticated science are will improve as it is examine din greater detail. For now it is fair to say that we can attribute current climate change with a fair amount of confidence to changes in the atmospheric composition since the beginning of the industrial age.
Occam’s/Ockham’s Razor Source: wikipedia
Misconceptions About Attribution
Source: Gavin Schmidt (NASA/GISS – RealClimate)
- You can’t do attribution based only on statistics
- Attribution has nothing to do with something being “unprecedented”
- You always need a model of some sort
- The more distinct the fingerprint of a particular cause is, the easier it is to detect
Links
- Related content
- Climate Models


