
Oceanic Systems
- Contents
-
- 1/8° Global NCOM Nowcast
- Ocean Heat Content
- Sea Level Rise (SLR)
- Sea Surface Temperatures/Anomalies
- Latest Sea Surface Temperature (SST) Daily
- Latest Sea Surface Temperature Daily Anomaly
- Latest Sea Surface Temperature (SST) Weekly
- Latest Sea Surface Temperature Weekly Anomaly
- Latest Sea Surface Temperature (SST) Monthly
- Latest Sea Surface Temperature Monthly Anomaly
- Weekly SST Anomalies for the past 52 weeks
- Seasonal SST Anomaly
- Time-Latitude plot of SST in the Pacific
- Sea Surface Temperature (SST)
- Sea Surface Height/Salinity/Mixed Layer Depth
- Oscillation Indices
- Monthly Teleconnection Indices
- Standard Outgoing Longwave Radiation (OLR) Anomalies
- Arctic Oscillation (AO)
- Antarctic Oscillation (AAO index)
- East Atlantic Pattern (EA)
- Scandanavia Pattern (SCAND)
- Polar Eurasian Pattern
- West Pacific Pattern (WP)
- East Pacific – North Pacific Pattern (EP-NP)
- East Atlantic/Western Russia Pattern
- Tropical/Northern Hemisphere Pattern (TNH)
- Pacific Transition Pattern (PT)
- Pacific Decadal Oscillation (PDO)
- Info: https://www.ncdc.noaa.gov/teleconnections/pdo/
- Pacific/North American (PNA) Index
- Southern Oscillation Index (SOI)
- El Nino/LaNina ENSO
- Tropical Cyclone Activity
| Note: Missing graphics may be due to temporary server maintenance (or the occasional gov. shutdown). |
1/8° Global NCOM Nowcast
You may click on the pictures below to get more information about SSH, SSS and SST in these predefined regions.
 |
 |
 |
| Global | Indian Ocean Region | Mediterranean |
 |
 |
 |
| Pacific Region | Atlantic Region | Arctic Region |
Ocean Heat Content
Note: The Ocean Heat Content (OHC) is estimated to absorb/contain 90% of the total heat energy that enters the Earth climate system from the sun. Therefore the ocean heat content can be considered the best measure of global warming or cooling over relevant time periods. As can be seen in the graph below the OHC is steadily rising. This is a confirming line of evidence that global warming has not stopped or paused between 1996 and 2014.

Source: NODC (National Oceanographic Data Center)
Sea Level Rise (SLR)
Topex, Jason-1, Jason-2, Jason-3
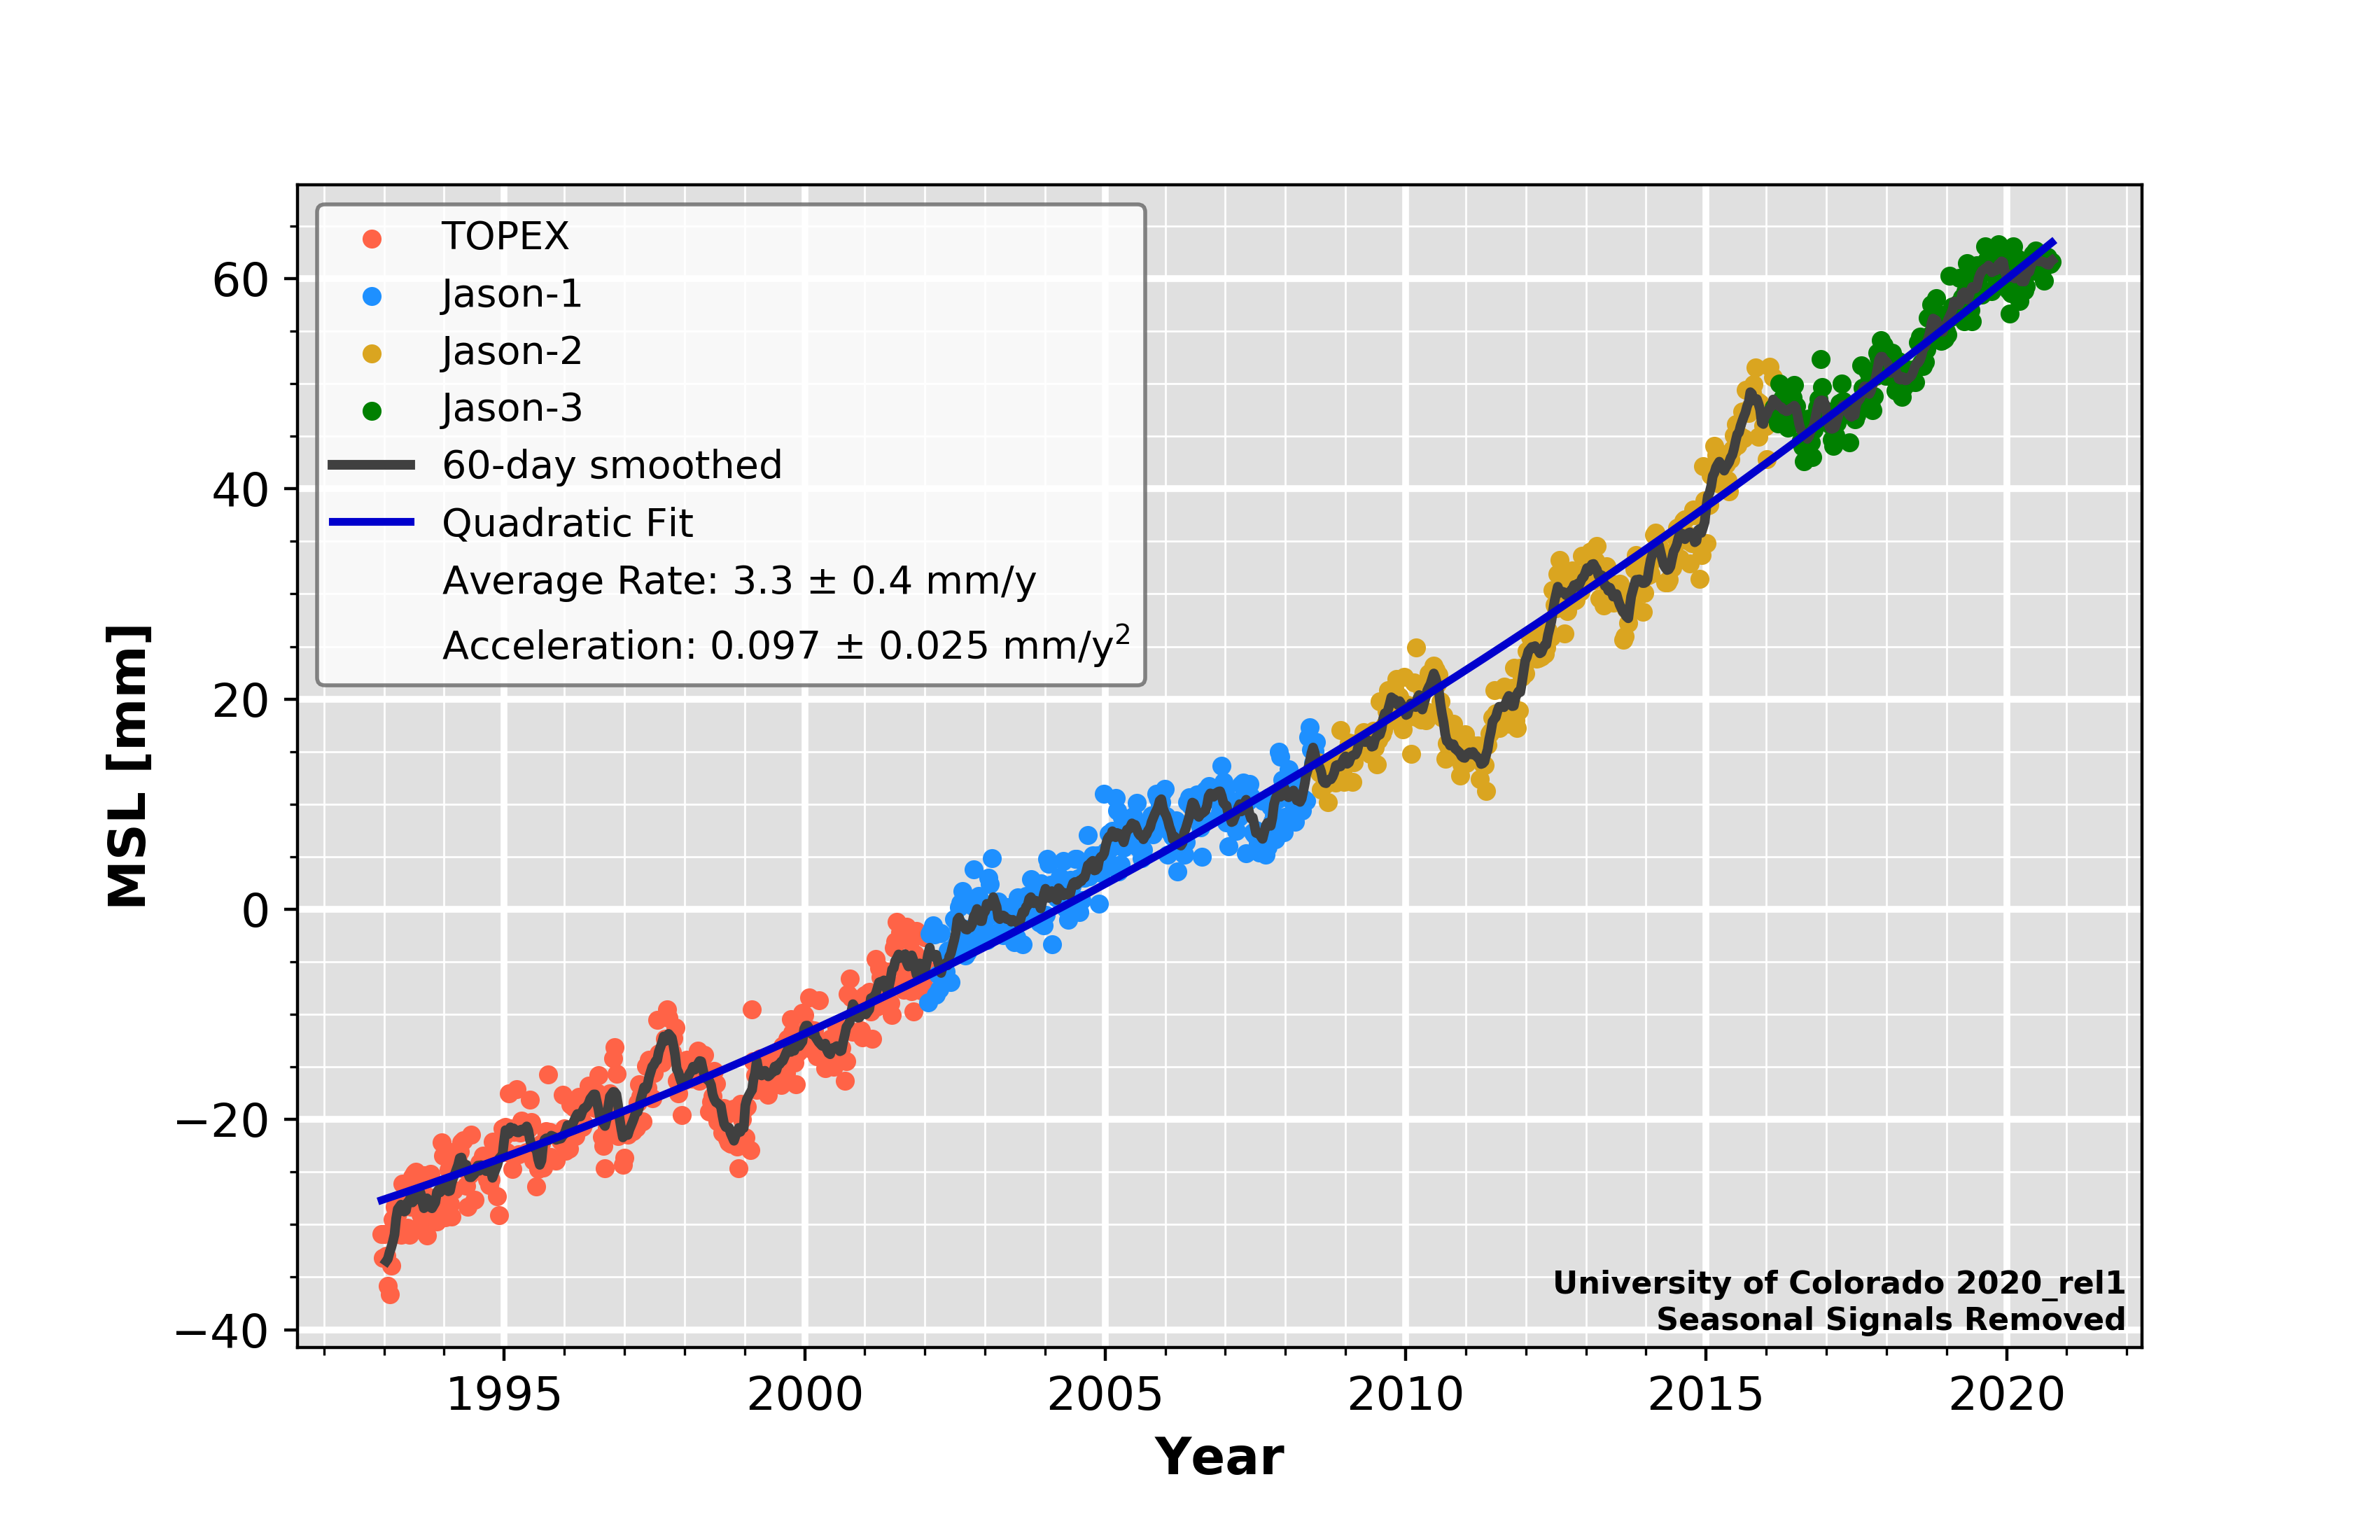
Source: https://sealevel.colorado.edu/
Sea Surface Temperatures/Anomalies
Latest Sea Surface Temperature (SST) Daily
Source: NOAA Earth System Research Laboratory
Latest Sea Surface Temperature Daily Anomaly

Source: NOAA Earth System Research Laboratory
Latest Sea Surface Temperature (SST) Weekly
Source: NOAA Earth System Research Laboratory
Latest Sea Surface Temperature Weekly Anomaly
Source: NOAA Earth System Research Laboratory
Latest Sea Surface Temperature (SST) Monthly
Source: NOAA Earth System Research Laboratory
Latest Sea Surface Temperature Monthly Anomaly
Source: NOAA Earth System Research Laboratory
Weekly SST Anomalies for the past 52 weeks

Source: NOAA Earth System Research Laboratory
Seasonal SST Anomaly
Source: NOAA Earth System Research Laboratory
Time-Latitude plot of SST in the Pacific
Source: NOAA Earth System Research Laboratory
Sea Surface Temperature (SST)

Source: Naval Research Laboratory Navy Coastal Ocean Model (NCOM)
Animation: NCOM SSS Global (30-day)
Animation: NCOM SSS Global (12-month)
Sea Surface Height/Salinity/Mixed Layer Depth
Sea Surface Height (SSH) Anomalies

Source: NOAA/NESDIS
Sea Surface Salinity (SSS)
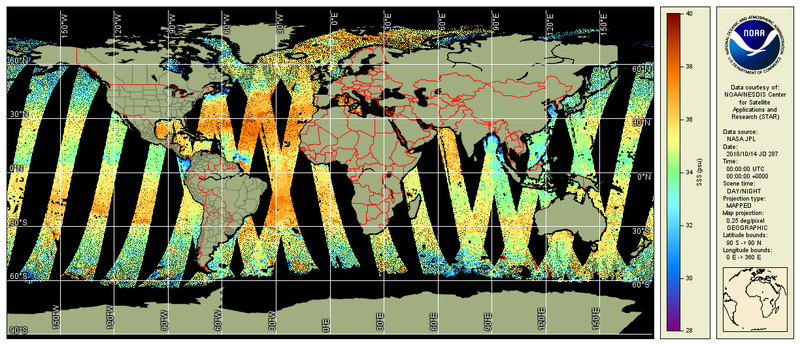
Source: NOAA/SSS
Mixed Layer Depth (MLD Link)
Source: Naval Research Laboratory (NRL) Mixed Layer Depth (NMLD) Climatology
Oscillation Indices
Monthly Teleconnection Indices
Source: NOAA Climate Prediction Center
Standard Outgoing Longwave Radiation (OLR) Anomalies
Time series
Source: https://www.ncdc.noaa.gov/teleconnections/enso/indicators/olr.php
Other sources: https://www.ncdc.noaa.gov/teleconnections/enso/indicators/olr/
Arctic Oscillation (AO)
Time series
 |
Source: https://www.ncdc.noaa.gov/teleconnections/ao/
Source: https://www.cpc.ncep.noaa.gov/products/precip/CWlink/daily_ao_index/hgt.shtml
Antarctic Oscillation (AAO index)
Source: NOAA Climate Prediction Center
North Atlantic Oscillation (NAO) Index
3-month running mean
Source: NOAA/NWS Climate Prediction Center
North Atlantic Oscillation ENSM

Source: https://www.ncdc.noaa.gov/teleconnections/nao/
East Atlantic Pattern (EA)
Source: https://www.cpc.ncep.noaa.gov/data/teledoc/ea_ts.shtml
Scandanavia Pattern (SCAND)
Source: https://www.cpc.ncep.noaa.gov/data/teledoc/scand_ts.shtml
Polar Eurasian Pattern
Source: https://www.cpc.ncep.noaa.gov/data/teledoc/poleur_ts.shtml
West Pacific Pattern (WP)
Source: https://www.cpc.ncep.noaa.gov/data/teledoc/wp_ts.shtml
East Pacific – North Pacific Pattern (EP-NP)

Source: https://www.cpc.ncep.noaa.gov/data/teledoc/ep_ts.shtml
East Atlantic/Western Russia Pattern
Source: NOAA/NWS Climate Prediction Center
Tropical/Northern Hemisphere Pattern (TNH)
Source: https://www.cpc.ncep.noaa.gov/data/teledoc/tnh.shtml
Pacific Transition Pattern (PT)
Source: https://www.cpc.ncep.noaa.gov/data/teledoc/pt.shtml
Pacific Decadal Oscillation (PDO)
Info: https://www.ncdc.noaa.gov/teleconnections/pdo/
Info: https://climatedataguide.ucar.edu/climate-data/pacific-decadal-oscillation-pdo-definition-and-indices
Info: https://www.ncdc.noaa.gov/teleconnections/pdo.php
Pacific/North American (PNA) Index
Source: https://www.cpc.ncep.noaa.gov/data/teledoc/pna_ts.shtml
Southern Oscillation Index (SOI)
Source: https://www.ncdc.noaa.gov/teleconnections/enso/indicators/soi/
El Nino/LaNina ENSO
Multivariate ENSO (El Nino Southern Oscillation)
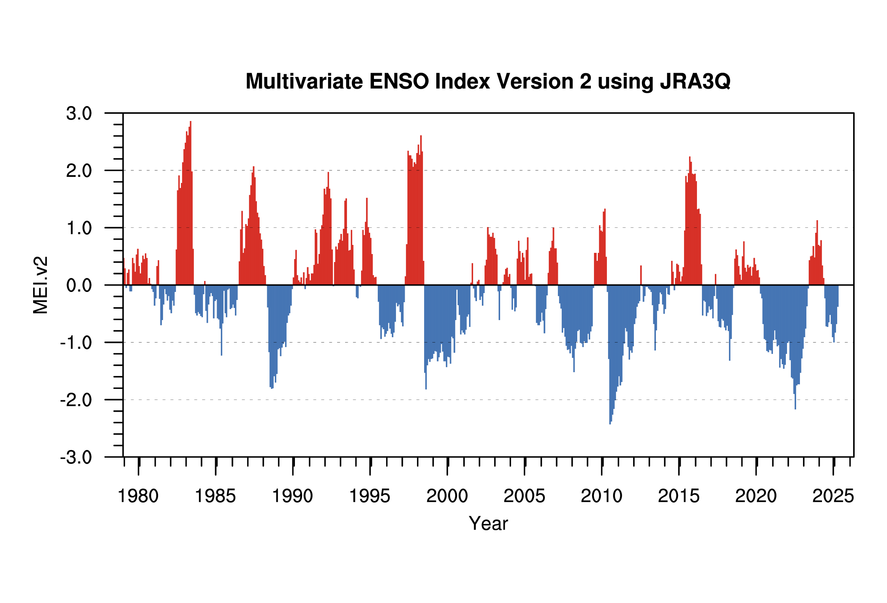
Source: https://psl.noaa.gov/enso/mei/
SST Anomaly in Nino 3.4 Region (5N-5S, 120W-170E)
Since year 2000

Source: https://www.ncdc.noaa.gov/teleconnections/enso/indicators/sst/
Tropical Cyclone Activity
Atlantic Cyclone Activity
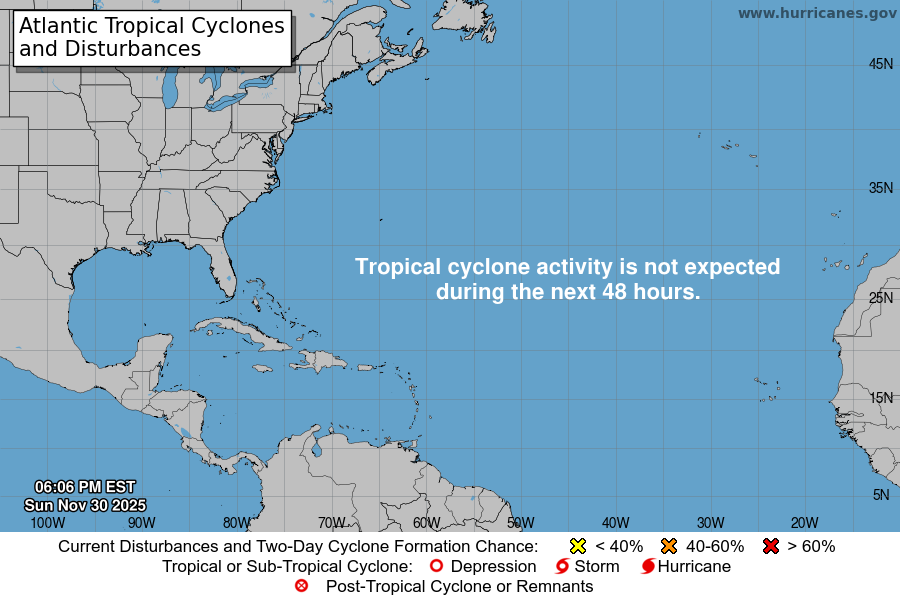
Source: https://www.nhc.noaa.gov/
Eastern Pacific Cyclone Activity
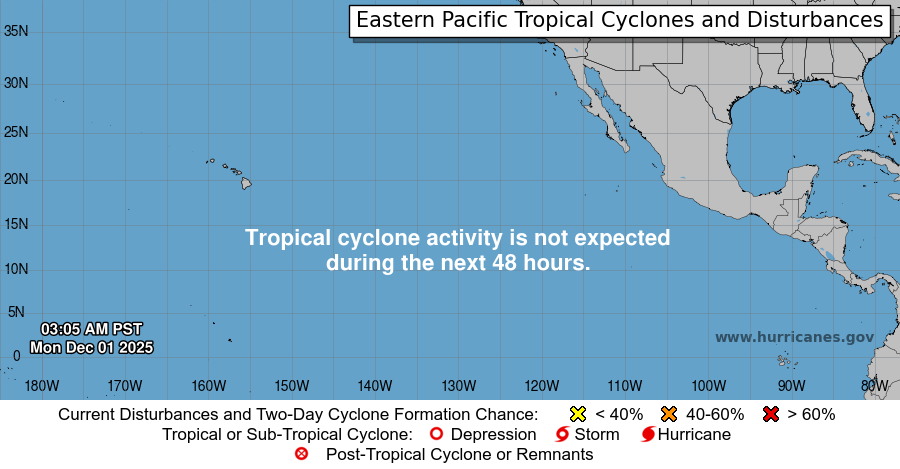
Source: https://www.nhc.noaa.gov/
Central Pacific Cyclone Activity
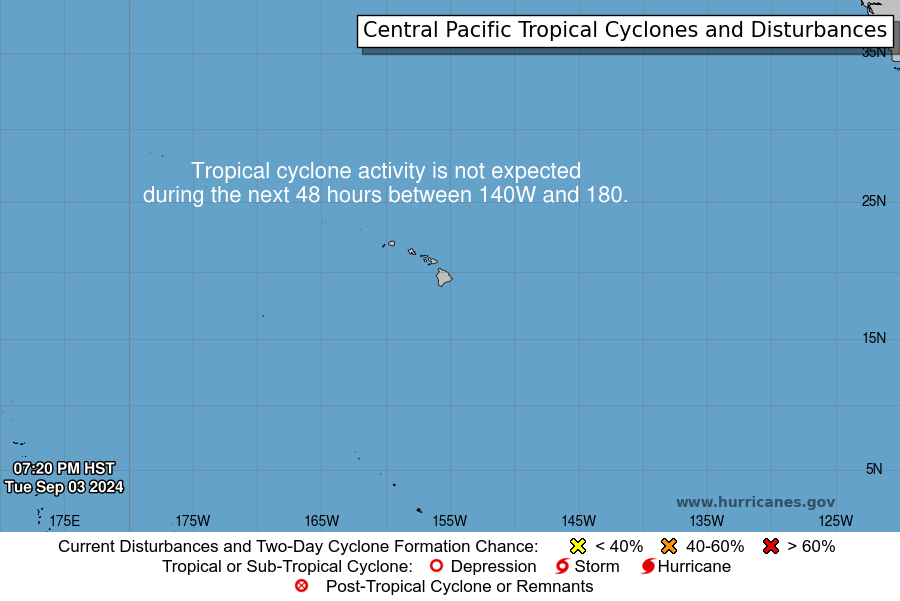
Source: https://www.nhc.noaa.gov/?cpac
https://www.prh.noaa.gov/hnl/cphc/
Western / South Pacific Ocean & India JTWC

JTWC Tropical Warnings