Antarctic Oscillation (AAO)
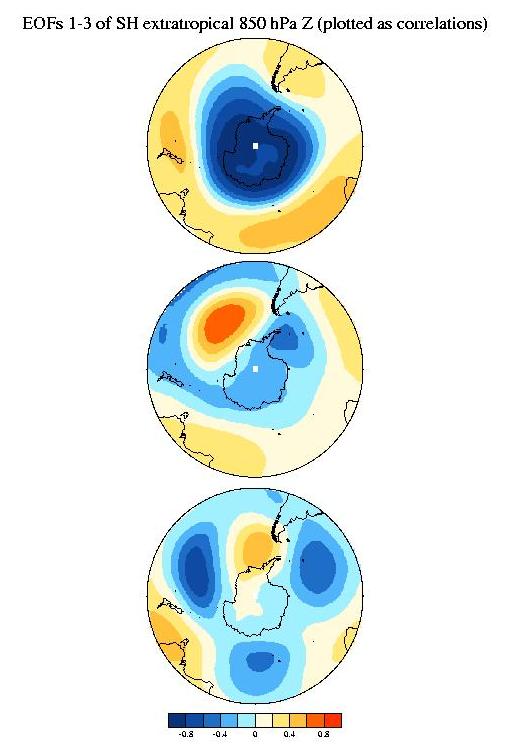
The Antarctic Oscillation (AAO) is the dominant pattern of non-seasonal tropospheric circulation variations south of 30S, and it is characterized by pressure anomalies of one sign centered in the Antarctic and anomalies of the opposite sign centered about 40-50S. The AAO is also referred to as the Southern Annular Mode (SAM). The AAO is defined as the leading principal component (PC) of 850 hPa geopotential height anomalies south of 30S (Thompson and Wallace 2000). For more information on the construction and analyses of this data, see: https://www.jisao.washington.edu/data/aao/
Source: https://cmr.earthdata.nasa.gov/search/concepts/C1214613421-SCIOPS.html
Antarctic Oscillation (AAO)
The daily AAO index is constructed by projecting the daily (00Z) 700mb height anomalies poleward of 20°S onto the loading pattern of the AAO. Please note that year-round monthly mean anomaly data has been used to obtain the loading pattern of the AAO (Methodology). Since the AAO has the largest variability during the cold sesaon, the loading pattern primarily captures characteristics of the cold season AAO pattern.
The daily AAO index and its forecasts using MRF and Ensemble mean forecast data are shown for the previous 120 days as indicated and they are normalized by standard deviation using 1979-2000 base period. A 3-day running mean is applied for the forecast indices.
| Observations |
 |
Source: NOAA/CPC
Antarctic Oscillation & ENSM Forecasts
https://www.cpc.ncep.noaa.gov/products/precip/CWlink/daily_ao_index/aao/new.aao_index_ensm.html
|
The indices are shown for the previous 120 days as indicated and they are normalized by standard deviation using a 1950-2000 base period. A 3-day running mean is applied to the forecasted indices. The values at the upper left and right corners of each figure indicate the mean value of the AAO index and the correlation coefficients between the observations and the forecasts, respectively. The first panel shows the observed AAO index (black line) plus forecasted AAO indices from each of the 11 MRF ensemble members starting from the last day of the observations (red lines). The ensemble mean forecasts of the AAO index are obtained by averaging the 11 MRF ensemble members (blue lines), and the observed AAO index (black line) is superimposed on each panel for comparison. For the forecasted indices (lower 3 panels), the yellow shading shows the ensemble mean plus and minus one standard deviation among the ensemble members, while the upper and lower red lines show the range of the forecasted indices, respectively. |
 |
Links

