Solar Influence
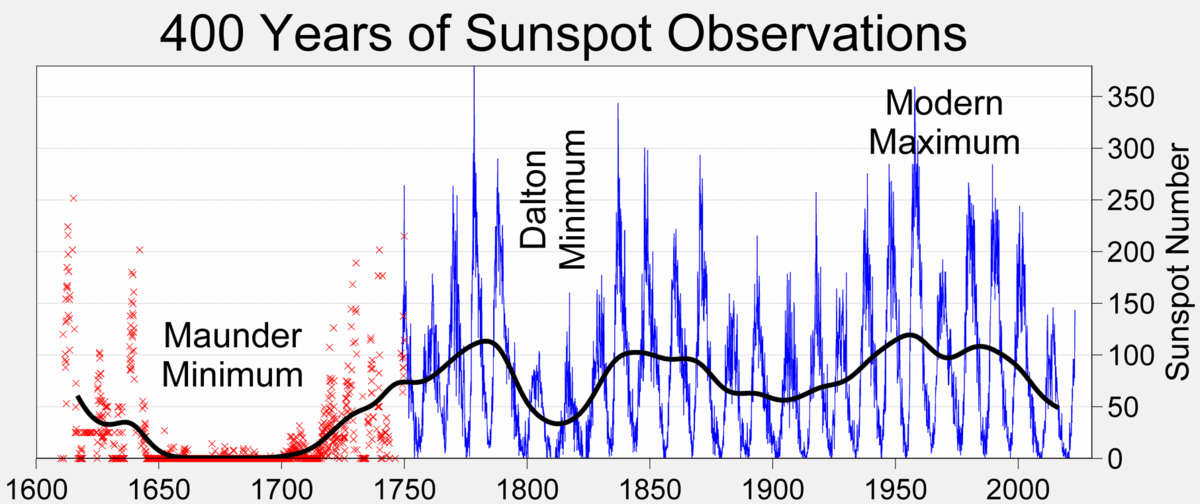
Observations of sunspots began in the time of Galileo, about 400 years ago. Heinrich Schwabe recognized the 11.1 year solar cycle average in 1843. Science is working to improve our understanding of solar activity but beyond 400 years it becomes increasingly speculative.
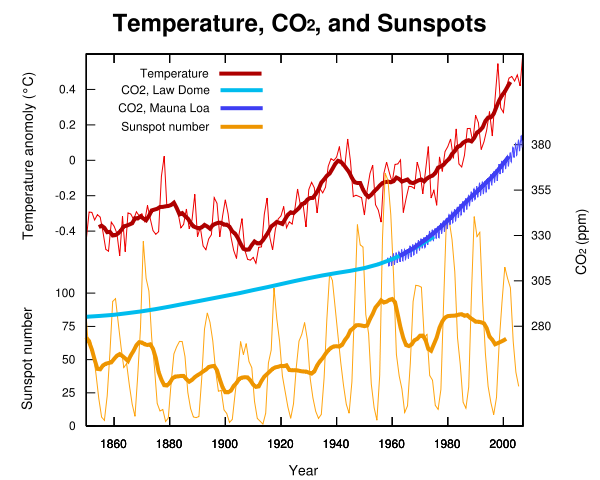
Temperature, CO2 & Sunspots do not correlate.
Does the sun cause global warming? Yes.
It would be very cold on earth without the sun. But that’s not the whole story. It turns out there are multiple factors that determine the temperature of a planet.
A suns age, size and distance are factors. But each planet has it’s own set of factors. having an atmosphere is first and foremost. If a planet does not have an atmosphere, then it’s just a big rock in space.
So, the ability of a planet to trap heat from the sun, and hold on to it in order to stay warm is related to the type of atmosphere. Think of it this way, if you owned a planet that could not hold heat, you would probably want to return it and purchase another one.
Another factor is your planets ability to release heat back to space. Too much of certain gases in the atmospheric composition can actually cause a planet to hold to much heat and that can be quite uncomfortable, depending on what type of life-form you are.
So when you think about earth, the better question is what is causing ‘current’ global warming in relation to natural cycles and atmospheric composition for our planet? Especially since the current climate forcing is now clearly outside of natural cycle forcing.
Scientists are attempting to derive methods to examine long term solar activity. Currently reasonable knowledge of solar cycles and activity is limited to sunspot observations for the past 400 years and satellite observations since 1979.
It is clear in the observations that sunspot numbers and temperature rise do not correlate.
The sun is our main energy provider. However, it alone does not determine how much heat energy is retained in our atmosphere. It provides energy, and our atmosphere captures and holds some of it. This is due to green house gases. If there were no greenhouse gases in our atmosphere, earth would be a frozen ball in space.
Solar Influence
The National Academy of Sciences
National Research Council, Board on Atmospheric Science and Climate
From the NAS movie Climate Change: Lines of Evidence:
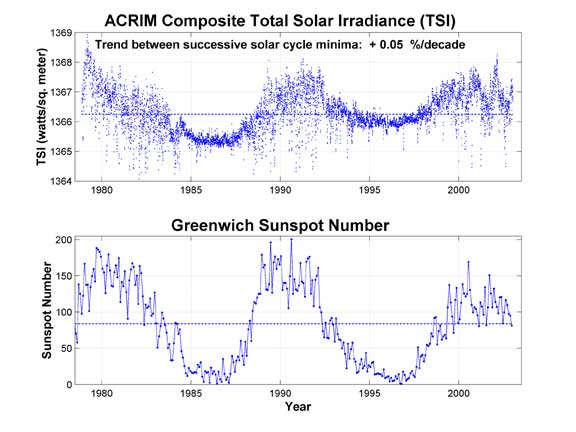
Below is a comparison of sunspot activity done with satellite measurements since 1979 compared to sunspot counts from Greenwich Observatory. When sunspot activity is low we lose approximately .2W/m2 of solar energy and regain that at a sunspot peak. It has been shown that these increases and decreases are related to weather on earth.
Sunspots
Sunspots have been observed since the time of Galileo. Since the Schwabe sunspot cycles average 11.1 years, we have limited data to see long term solar cycles clearly. But the short term Schwabe cycles are quite clear in the sunspot record.
These cycles range from 9 to 14 years in lengths with an average length of 11. years. As of early 2009 we are in an extended solar minimum, similar to the one noted around 1913. We are entering Solar Cycle 24 and you can monitor the entry to the new solar cycle with the links below.
- https://solarcycle24.com/
- https://sohowww.nascom.nasa.gov/data/realtime-images.html
- https://earthobservatory.nasa.gov/Features/SolarMax/
The solar variance between solar maximum and solar minimum accounts of a change in total solar irradiance of around 0.2 W/m2. The current forcing above natural cycle is 1.6W/m2, all major forcings considered. This clearly illustrates that our current global warming event can not be attributed to solar forcing from the sunspot cycle.
There is also a slight irradiance increase in solar output that has been noticed by NASA, but that also does not provide nearly enough forcing to account for current forcing above natural cycle. The only attribution possible is industrial greenhouse gases which are easily calculated quantitatively and the amount of forcing this provides in the system matches the amount of climate forcing we are observing.
Source: Max Planck Society
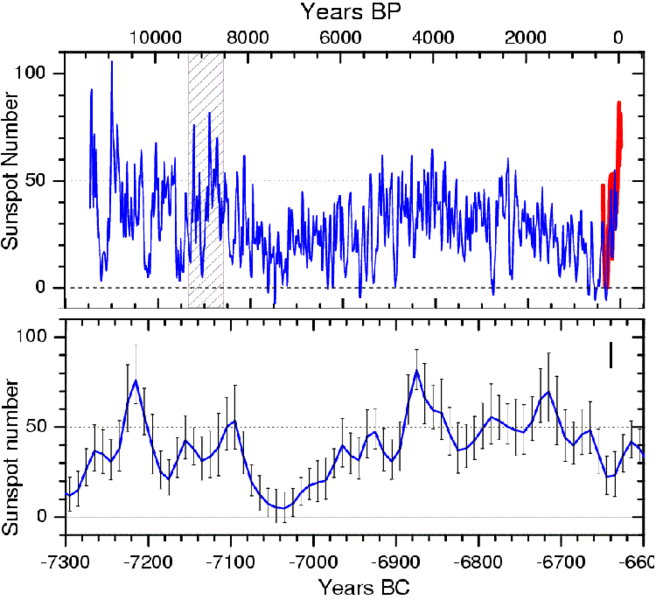
Top: Reconstructed sunspot activity (10 year average) for the last 11,400 years based on C-14 data (blue curve) and the directly observed historical sunspot data since 1610 (red curve). The reliable C-14 data ends around the year 1900 so that the sharp increase in sunspot activity in the 20th century does not appear in the graph. The reconstruction shows clearly that a comparable period of high sunspot activity previously existed over 8000 years ago. Below: An enlarged section of the upper graph (hatched area) with several episodes of higher sun activity; comparable to the 20th century.
“Researchers at the Max Planck Society have shown that the Sun can be responsible for, at most, only a small part of the warming over the last 20-30 years.”
Source: Max Planck Society
Links
- https://solarscience.msfc.nasa.gov/SunspotCycle.shtml
- https://earthobservatory.nasa.gov/Features/SolarMax/
- Current View of the Sun: https://sohowww.nascom.nasa.gov/data/realtime-images.html
- Current Solar Trends: https://solarcycle24.com/
- https://www.hao.ucar.edu/Public/education/bios/schwabe.html
- https://earthobservatory.nasa.gov/Features/SolarMax/solarmax.php
- https://earthobservatory.nasa.gov/Features/SolarMax/solarmax_2.php
- https://istp.gsfc.nasa.gov/Education/whsun.html
- https://science.nasa.gov/headlines/y2008/11jul_solarcycleupdate.htm
- https://www.swpc.noaa.gov/SolarCycle/
Solar forcing – RealClimate:
- Recent Warming But No Trend in Galactic Cosmic Rays
- A critique on Veizer’s Celestial Climate Driver
- The lure of solar forcing
- Did the Sun hit record highs over the last few decades?
- Another study on solar influence
- The trouble with sunspots
- How not to attribute climate change
- Taking Cosmic Rays for a spin
- Nigel Calder in the Times
- ‘Cosmoclimatology’ – tired old arguments in new clothes (
 ) (
) ( )
) - Cosmic rays don’t die so easily
- Related content
- Solar
- Solar Conditions


