
Southern Oscillation Index (SOI)
The Southern Oscillation Index (SOI) is one measure of the large-scale fluctuations in air pressure occurring between the western and eastern tropical Pacific (i.e., the state of the Southern Oscillation) during El Niño and La Niña episodes. Traditionally, this index has been calculated based on the differences in air pressure anomaly between Tahiti and Darwin, Australia.
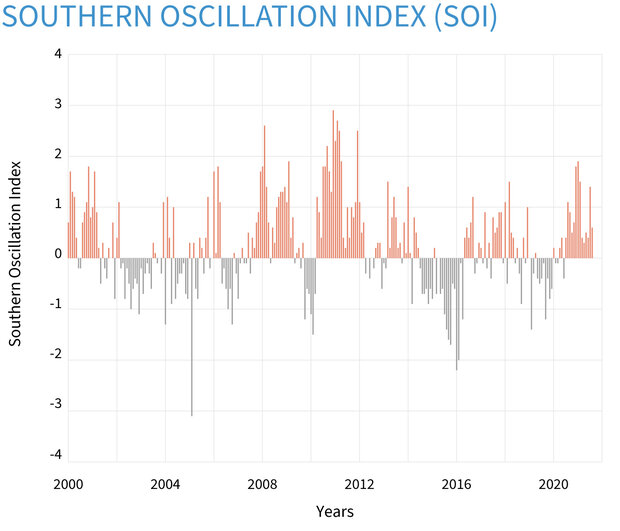
Monthly surface pressure anomalies—differences from the 1981-2010 average—in Darwin, Australia, compared to Tahiti. Positive values indicate a strong Walker Circulation, which occurs during La Niña. Negative values indicate a weak or disrupted Walker Circulation, which occurs during El Niño. NOAA Climate.gov image, based on data from the Climate Prediction Center.
Source Links:
In general, smoothed time series of the SOI correspond very well with changes in ocean temperatures across the eastern tropical Pacific. The negative phase of the SOI represents below-normal air pressure at Tahiti and above-normal air pressure at Darwin. Prolonged periods of negative SOI values coincide with abnormally warm ocean waters across the eastern tropical Pacific typical of El Niño episodes. Prolonged periods of positive SOI values coincide with abnormally cold ocean waters across the eastern tropical Pacific typical of La Niña episodes.
The time series of the SOI and sea surface temperatures in the eastern equatorial Pacific indicates that the ENSO cycle has an average period of about four years, although in the historical record the period has varied between two and seven years. The 1980’s and 1990’s featured a very active ENSO cycle, with 5 El Niño episodes (1982/83, 1986/87, 1991-1993, 1994/95, and 1997/98) and 3 La Niña episodes (1984/85, 1988/89, 1995/96) occurring during the period. This period also featured two of the strongest El Niño episodes of the century (1982/83 and 1997/98), as well as two consecutive periods of El Niño conditions during 1991 – 1995 without an intervening cold episode. Historically, there is considerable variability in the ENSO cycle from one decade to the next. For example, there are decades in which the cycle was relatively inactive, and decades in which it was quite pronounced.
In addition to the Ocean Niño index, atmospheric measurements can indicate the status of the El Niño – Southern Oscillation cycle. As El Niño conditions develop, sea surface temperatures in the eastern Pacific Ocean increase and air pressure over the region decreases. Simultaneously, higher air pressure develops over the cooler sea surface in the western Pacific, near Indonesia. Thus, the difference in air pressure between these two regions provides another way to monitor the ENSO cycle.

Comparisons of atmospheric pressure at Tahiti and Darwin, Australia, and over swaths of the Eastern Pacific (EPAC) and Indonesia (INDO) indicate El Niño – Southern Oscillation conditions.
The Southern Oscillation Index or SOI represents the difference in average air pressure measured at Tahiti and Darwin, Australia. More specifically, the SOI is calculated as the difference in monthly averages of standardized mean sea level pressure at each station.

Source: NOAA Climate Services
Similarly, the Equatorial Southern Oscillation Index or EQSOI represents the difference in air pressure measured over the eastern and western Pacific. The EQSOI is calculated as the difference in standardized mean sea level pressure over a swath of the eastern equatorial Pacific Ocean (5°N-5°S, 80°W-130°W) and another swath that spans Indonesia (5°N-5°S, 90°E-140°E).
During El Niño conditions, when air pressure is above average over the western Pacific and below average over the eastern Pacific, values for the SOI and EQSOI are negative. Conversely, La Niña conditions result in positive values for the two atmospheric indices.

Source: NOAA Climate Services
Recent Southern Oscillation Index

Source: https://www.weatherzone.com.au/climate/indicator_enso.jsp?c=soi
Links
- https://www.cpc.noaa.gov/products/analysis_monitoring/ensocycle/soi.shtml
- https://www.cgd.ucar.edu/cas/catalog/climind/soi.html
- https://www.climatewatch.noaa.gov/2009/articles/climate-variability-southern-oscillation-index
- https://www.metoffice.gov.uk/climatechange/science/monitoring/hadslp2.html
- https://www.cgd.ucar.edu/cas/catalog/climind/soi.html