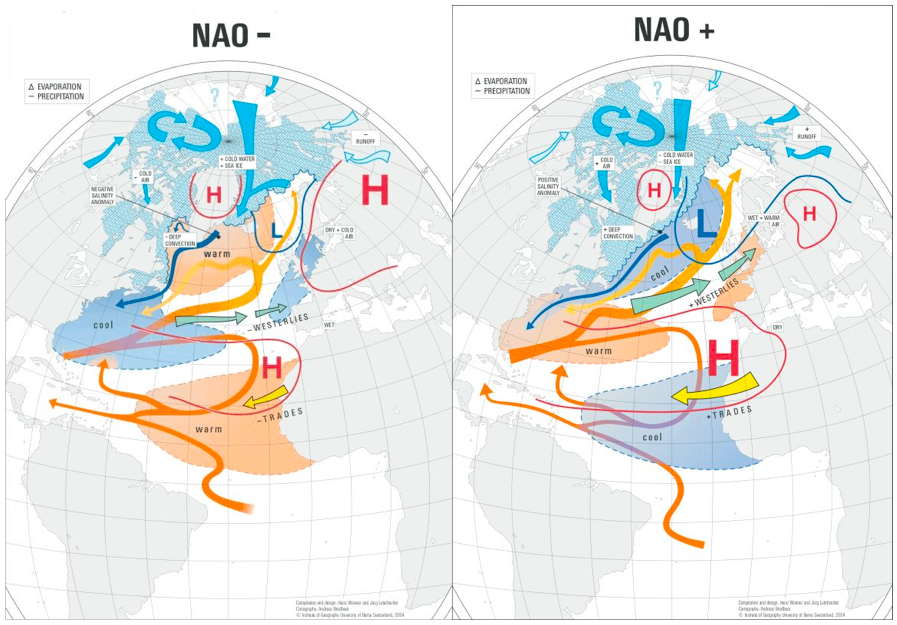
North Atlantic Oscillation (NAO)
The North Atlantic Oscillation (NAO) is a measure of the strength of the westerlies across the North Atlantic. Originally defined by Sir Gilbert Walker in 1932 as the difference in pressure between Ponta Delgada on the Azores and Stykkisholmur in Iceland.
The North Atlantic Oscillation (NAO) index is based on the surface sea-level pressure difference between the Subtropical (Azores) High and the Subpolar Low. The positive phase of the NAO reflects below-normal heights and pressure across the high latitudes of the North Atlantic and above-normal heights and pressure over the central North Atlantic, the eastern United States and western Europe. The negative phase reflects an opposite pattern of height and pressure anomalies over these regions. Both phases of the NAO are associated with basin-wide changes in the intensity and location of the North Atlantic jet stream and storm track, and in large-scale modulations of the normal patterns of zonal and meridional heat and moisture transport, which in turn results in changes in temperature and precipitation patterns often extending from eastern North America to western and central Europe.
 Pacific Decadal Oscillation (PDO) Period of Record Time series |
Strong positive phases of the NAO tend to be associated with above-normal temperatures in the eastern United States and across northern Europe and below-normal temperatures in Greenland and oftentimes across southern Europe and the Middle East. They are also associated with above-normal precipitation over northern Europe and Scandinavia and below-normal precipitation over southern and central Europe. Opposite patterns of temperature and precipitation anomalies are typically observed during strong negative phases of the NAO. During particularly prolonged periods dominated by one particular phase of the NAO, abnormal height and temperature patterns are also often seen extending well into central Russia and north-central Siberia. The NAO exhibits considerable interseasonal and interannual variability, and prolonged periods (several months) of both positive and negative phases of the pattern are common.
The NAO index is obtained by projecting the NAO loading pattern to the daily anomaly 500 millibar height field over 0-90°N. The NAO loading pattern has been chosen as the first mode of a Rotated Empirical Orthogonal Function (EOF) analysis using monthly mean 500 millibar height anomaly data from 1950 to 2000 over 0-90°N latitude.
Source: https://www.ldeo.columbia.edu/res/pi/NAO/
NAO Observed & ENSM Forecasts
Source: https://www.cpc.noaa.gov/products/precip/CWlink/pna/nao.shtml
Links
- https://www.cpc.ncep.noaa.gov/data/teledoc/nao.shtml
- https://www.ncdc.noaa.gov/teleconnections/nao/
- https://www.ldeo.columbia.edu/res/pi/NAO/
- https://www.giub.unibe.ch/klimet/wanner/nao.html
- https://www.cpc.noaa.gov/data/teledoc/nao.shtml
- https://www.cpc.noaa.gov/products/precip/CWlink/pna/nao.shtml
- https://www.cgd.ucar.edu/cas/jhurrell/indices.html
- https://www.cru.uea.ac.uk/cru/data/nao.htm
- https://www.giub.unibe.ch/klimet/wanner/nao.html
- 2004/11 RealClimate: North Atlantic Oscillation (nao)
- https://en.wikipedia.org/wiki/North_Atlantic_oscillation


