
Arctic/Greenland/Cryosphere
- Contents
-
- CRYOSPHERE
- Movies and snapshots of the 1/12° Global HYCOM
- Snow Cover
- a href id=”Fall Northern Hemisphere Snow Extent”>Fall Northern Hemisphere Snow Extent>
- Winter Northern Hemisphere Snow Extent
- Spring Northern Hemisphere Snow Extent
- Links
| Note: Missing graphics may be due to temporary server maintenance (or the occasional gov. shutdown). |
| Note: USN servers have been moved. OSS is retargeting data locations (Sep. Oct. 2013)
CRYOSPHERE
Arctic Trends
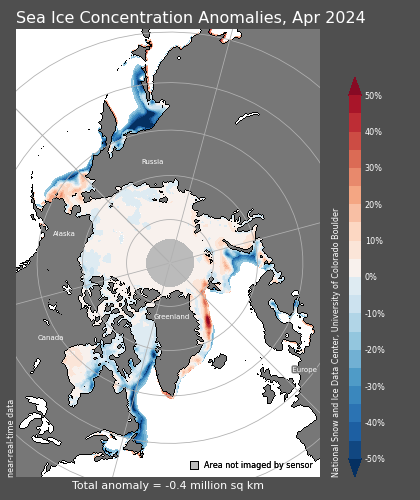
Arctic Ice Extent (areas with at least 15% ice coverage) [updates daily]

Source: National Snow & Ice Data Center
Graph: https://nsidc.org/data/seaice_index/images/daily_images/N_stddev_timeseries.png


Arctic Sea Ice Volume

Source: http://psc.apl.uw.edu/research/projects/arctic-sea-ice-volume-anomaly/
Arctic Sea Ice Volume

Source: http://psc.apl.uw.edu/research/projects/arctic-sea-ice-volume-anomaly/
Arctic Sea Ice Volume

Source: http://psc.apl.uw.edu/research/projects/arctic-sea-ice-volume-anomaly/


Greenland
Daily Melt


Source: https://nsidc.org/greenland-today/
Snow Cover
Note: Global warming is increasing the moisture content of the atmosphere due to warmer oceans. This could manifest as an increase in snow extent. The warmer atmospheric temperatures altering season lengths should melt the snow faster in the spring. The data does indicate this to be true. We will add to this section if direct attribution studies are conducted.
Fall Northern Hemisphere Snow Extent
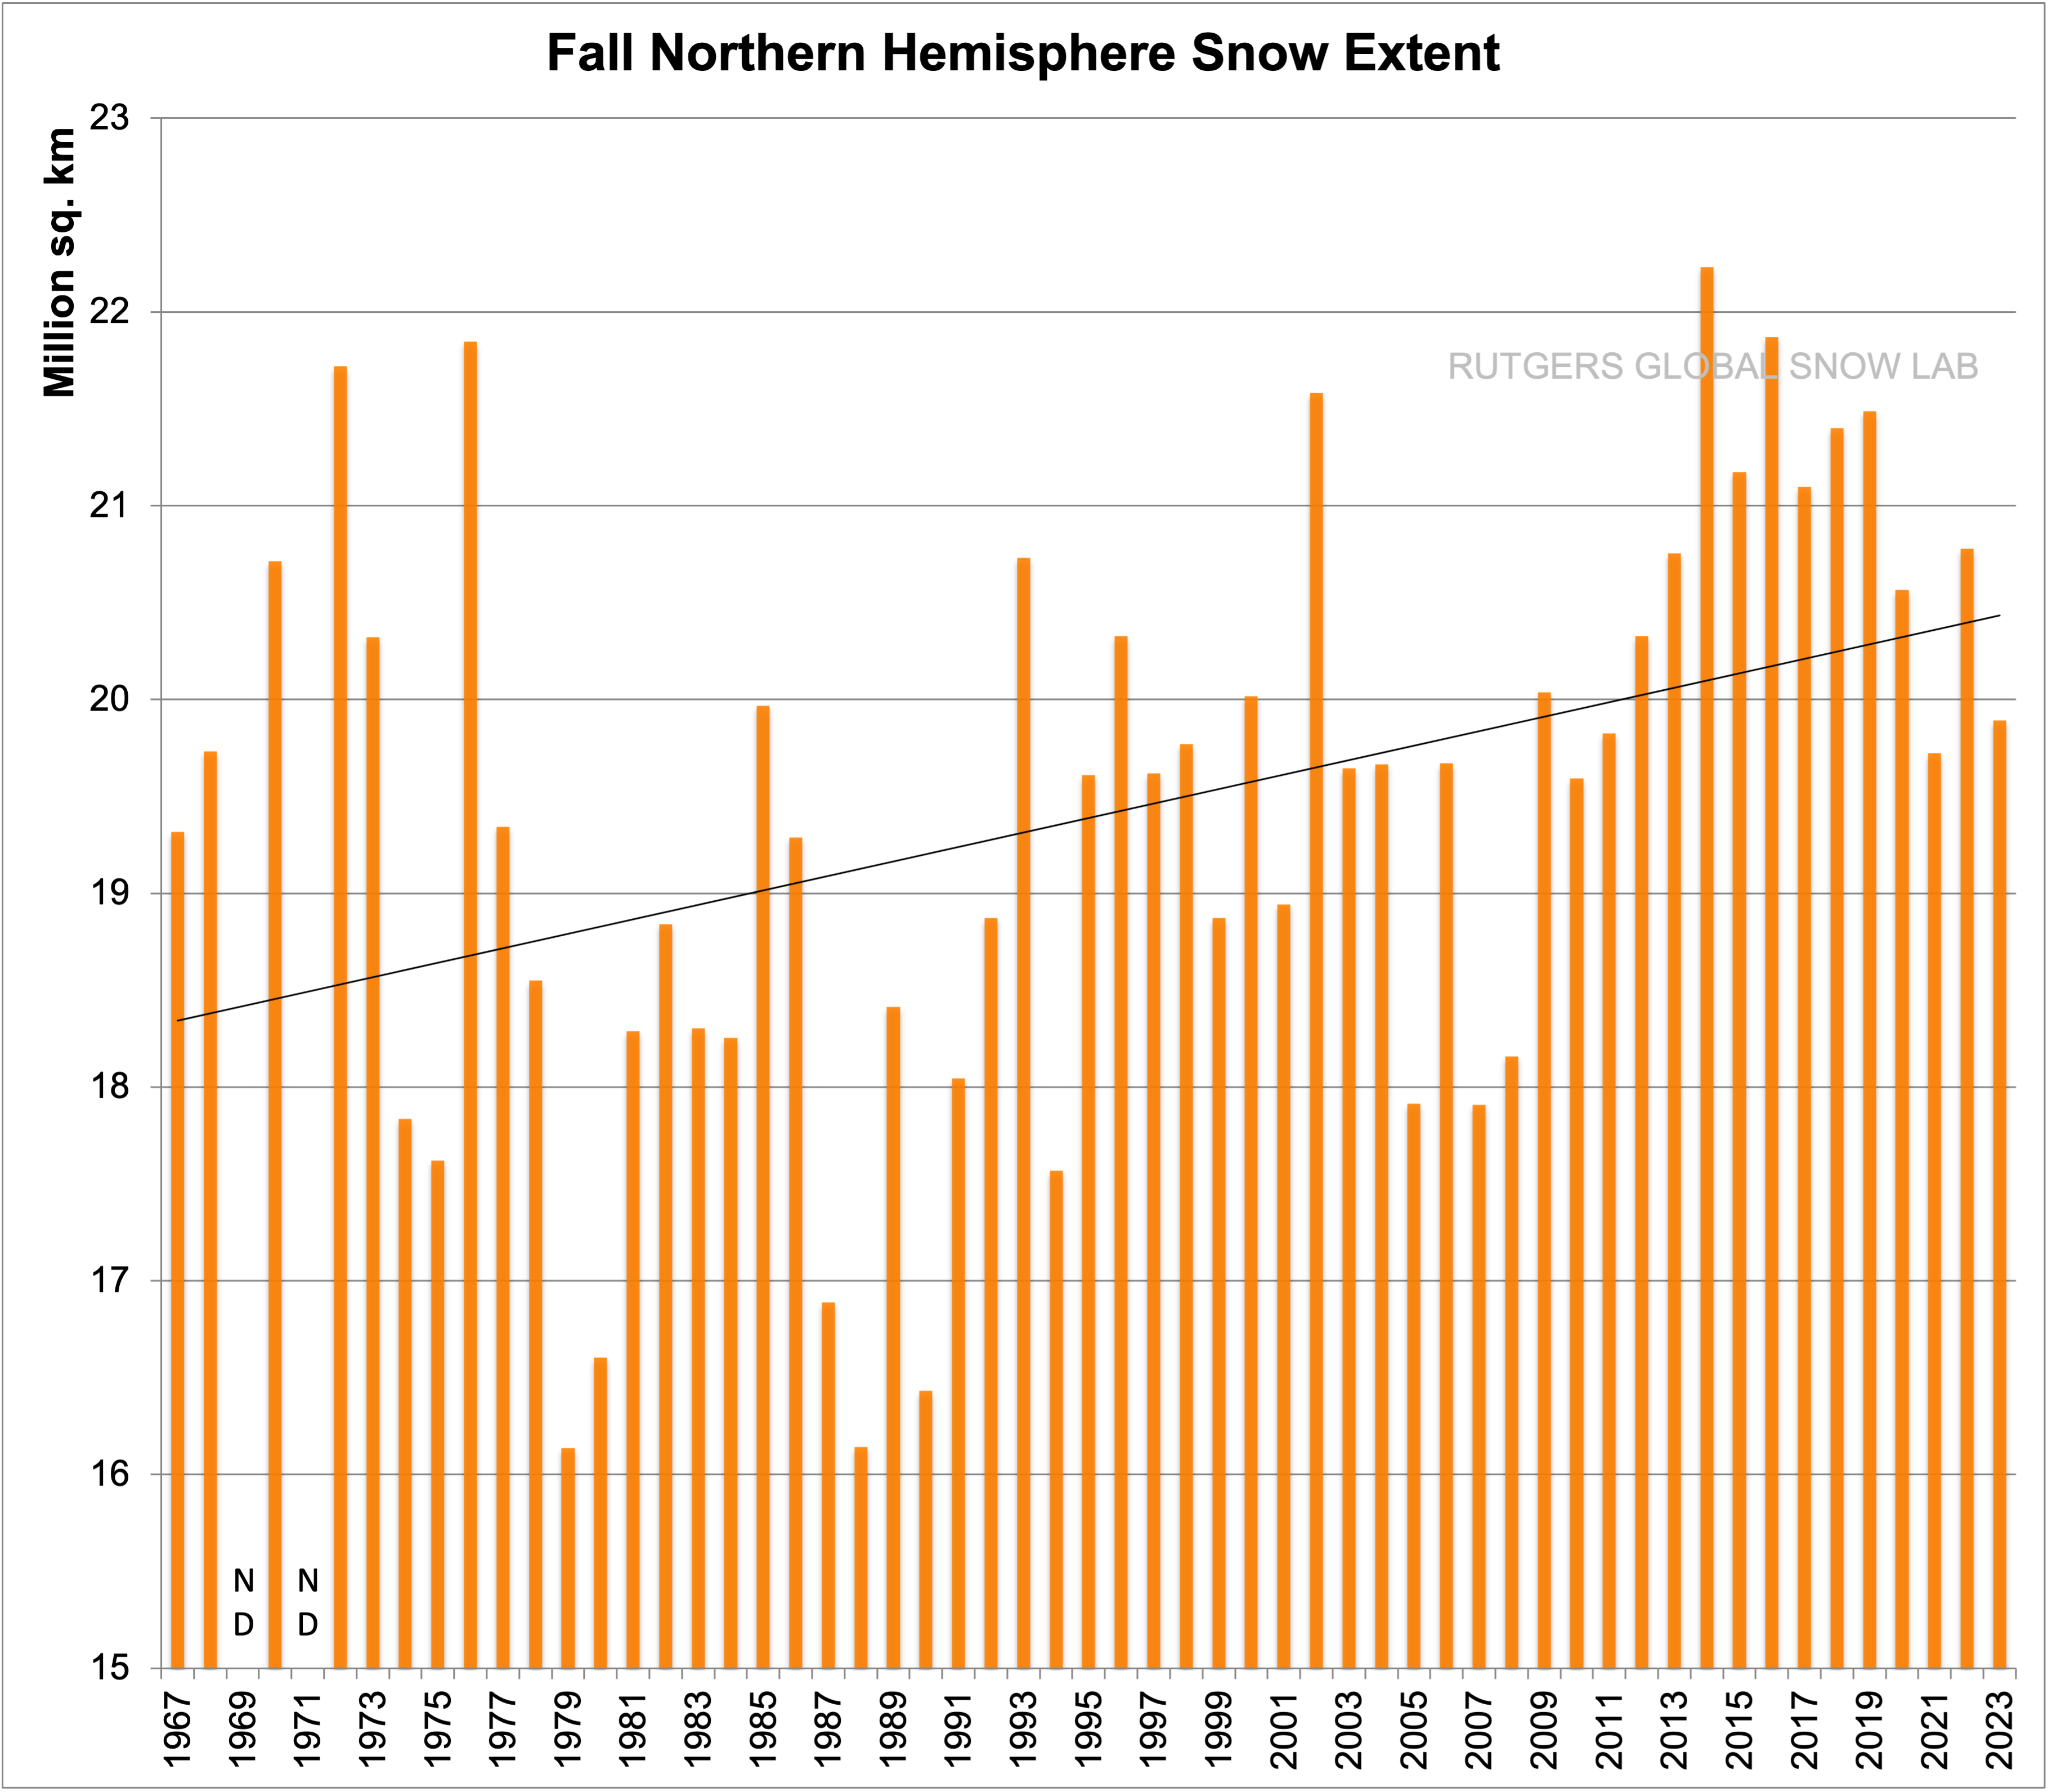
ND indicates no data for a given year.
Source: https://climate.rutgers.edu/snowcover/images/nhland_season4.png
Winter Northern Hemisphere Snow Extent
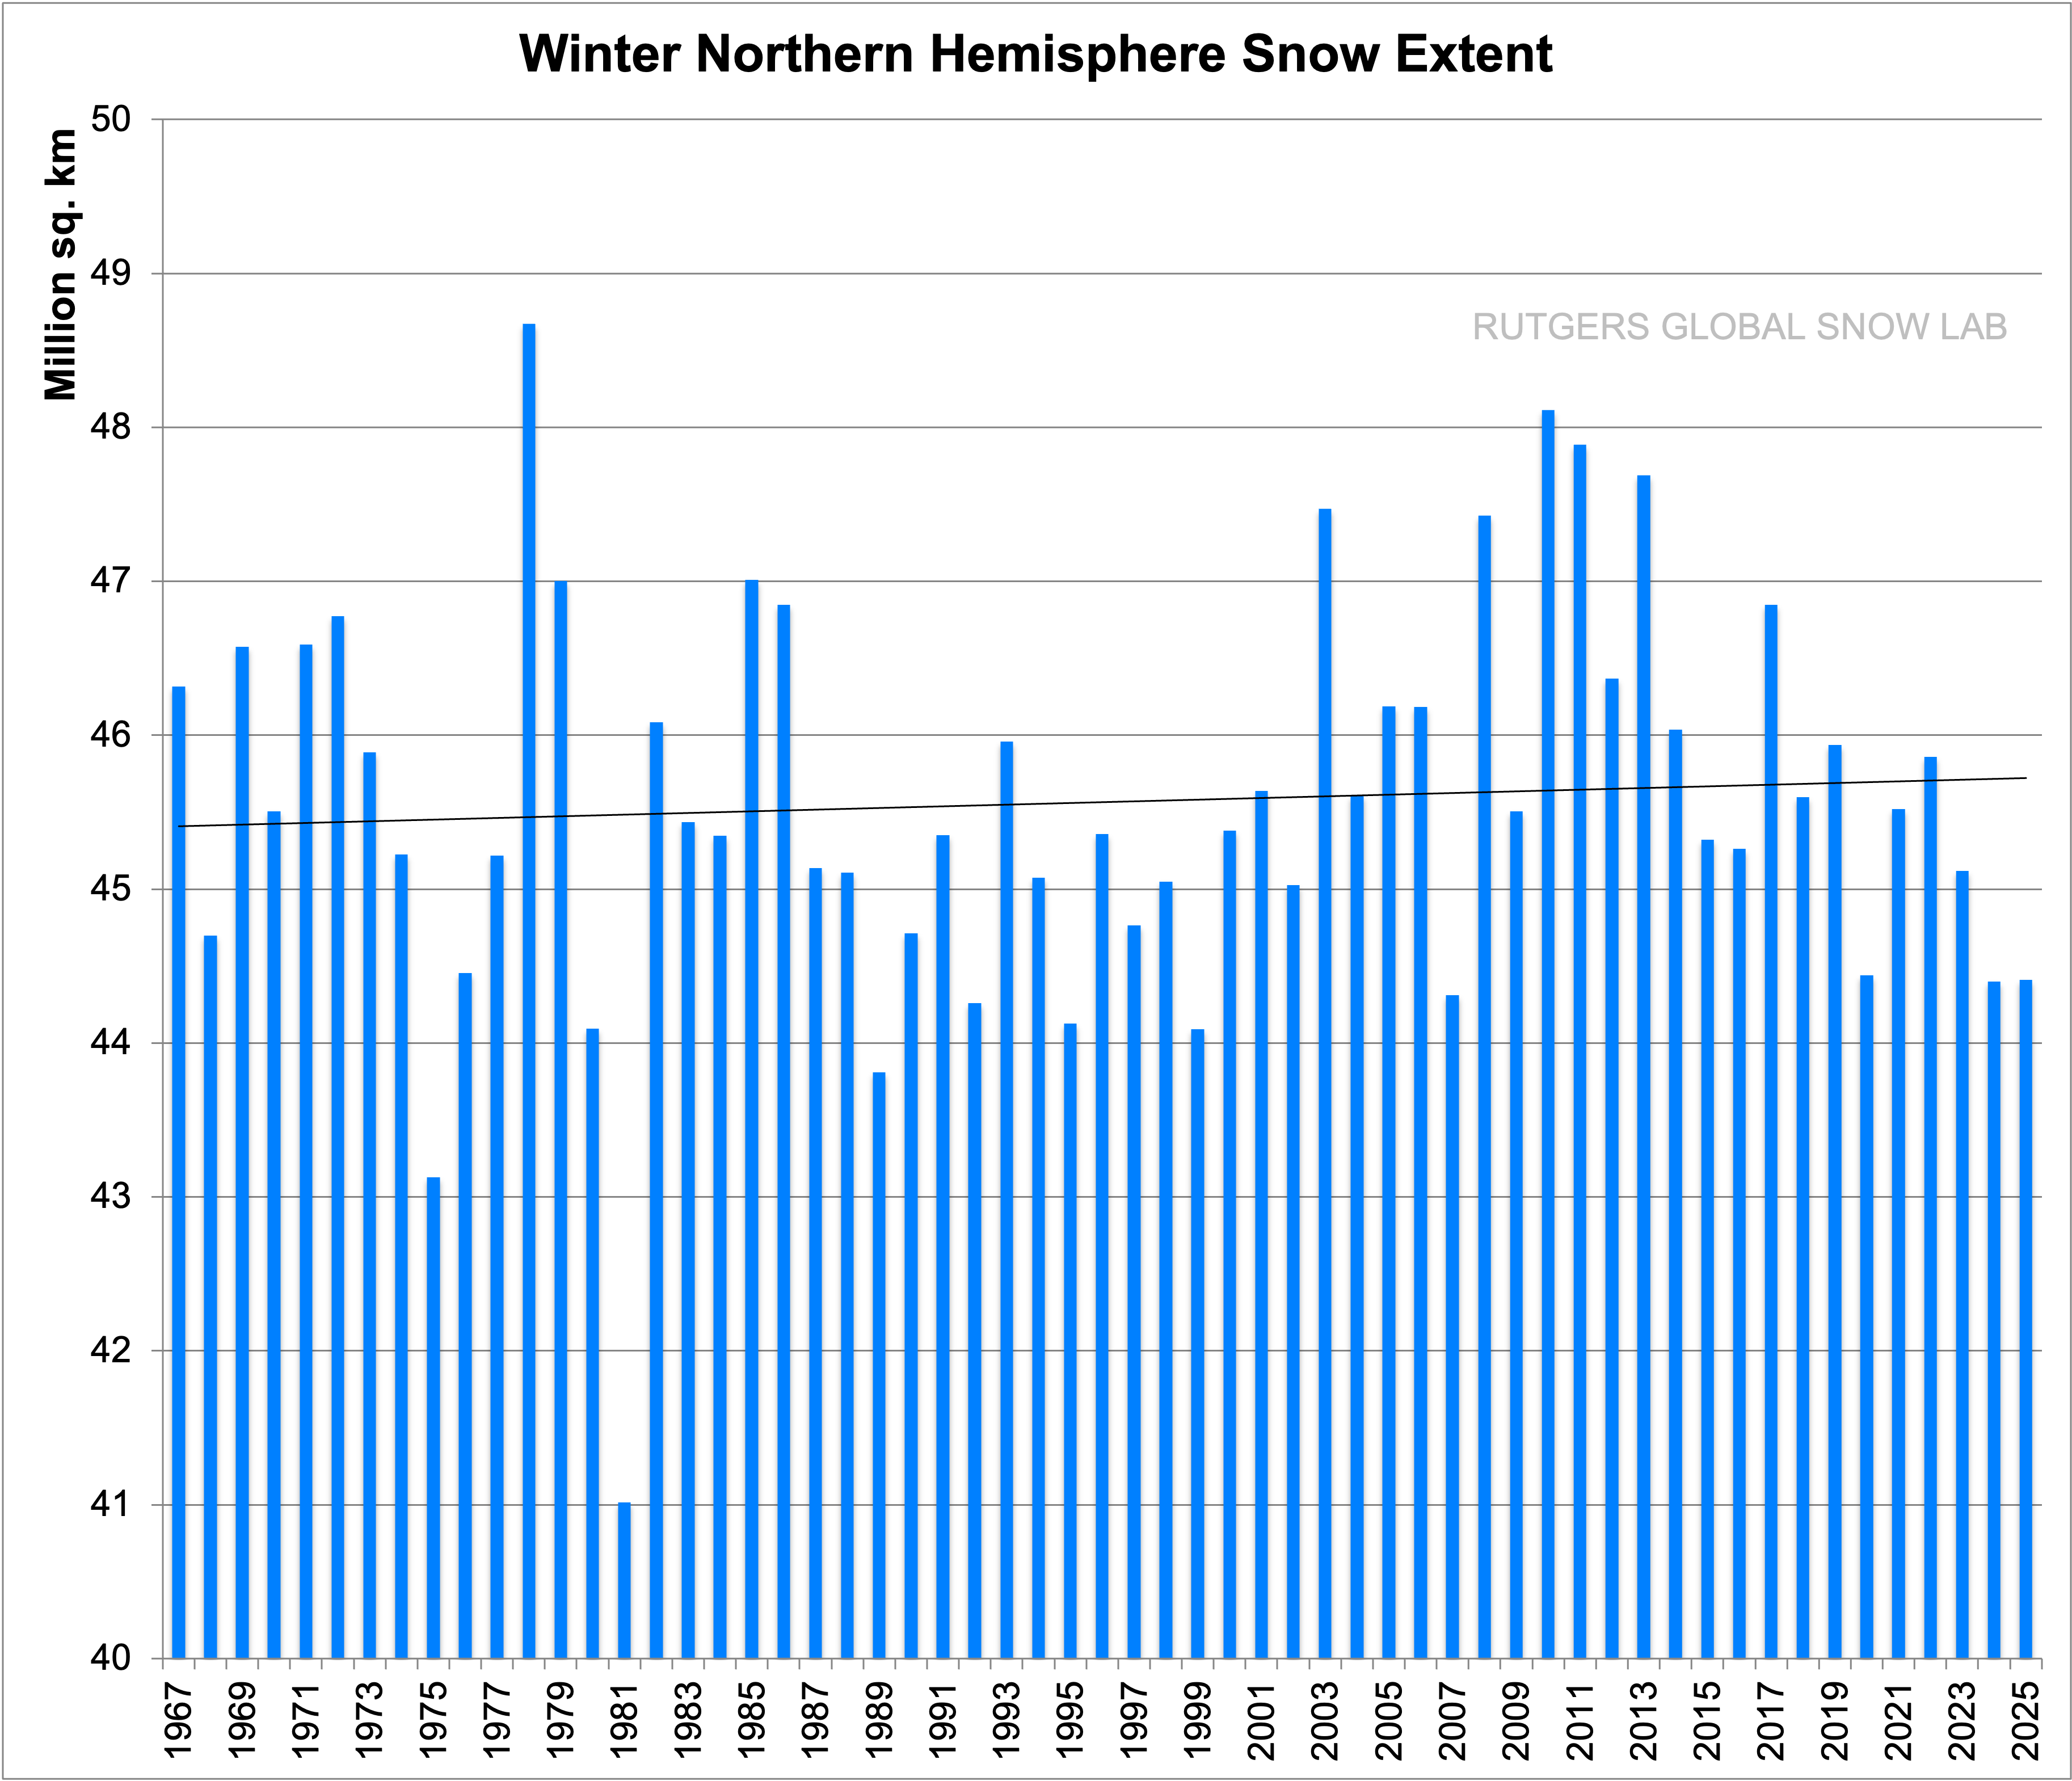
ND indicates no data for a given year.
Source: https://climate.rutgers.edu/snowcover/images/nhland_season1.png
Spring Northern Hemisphere Snow Extent
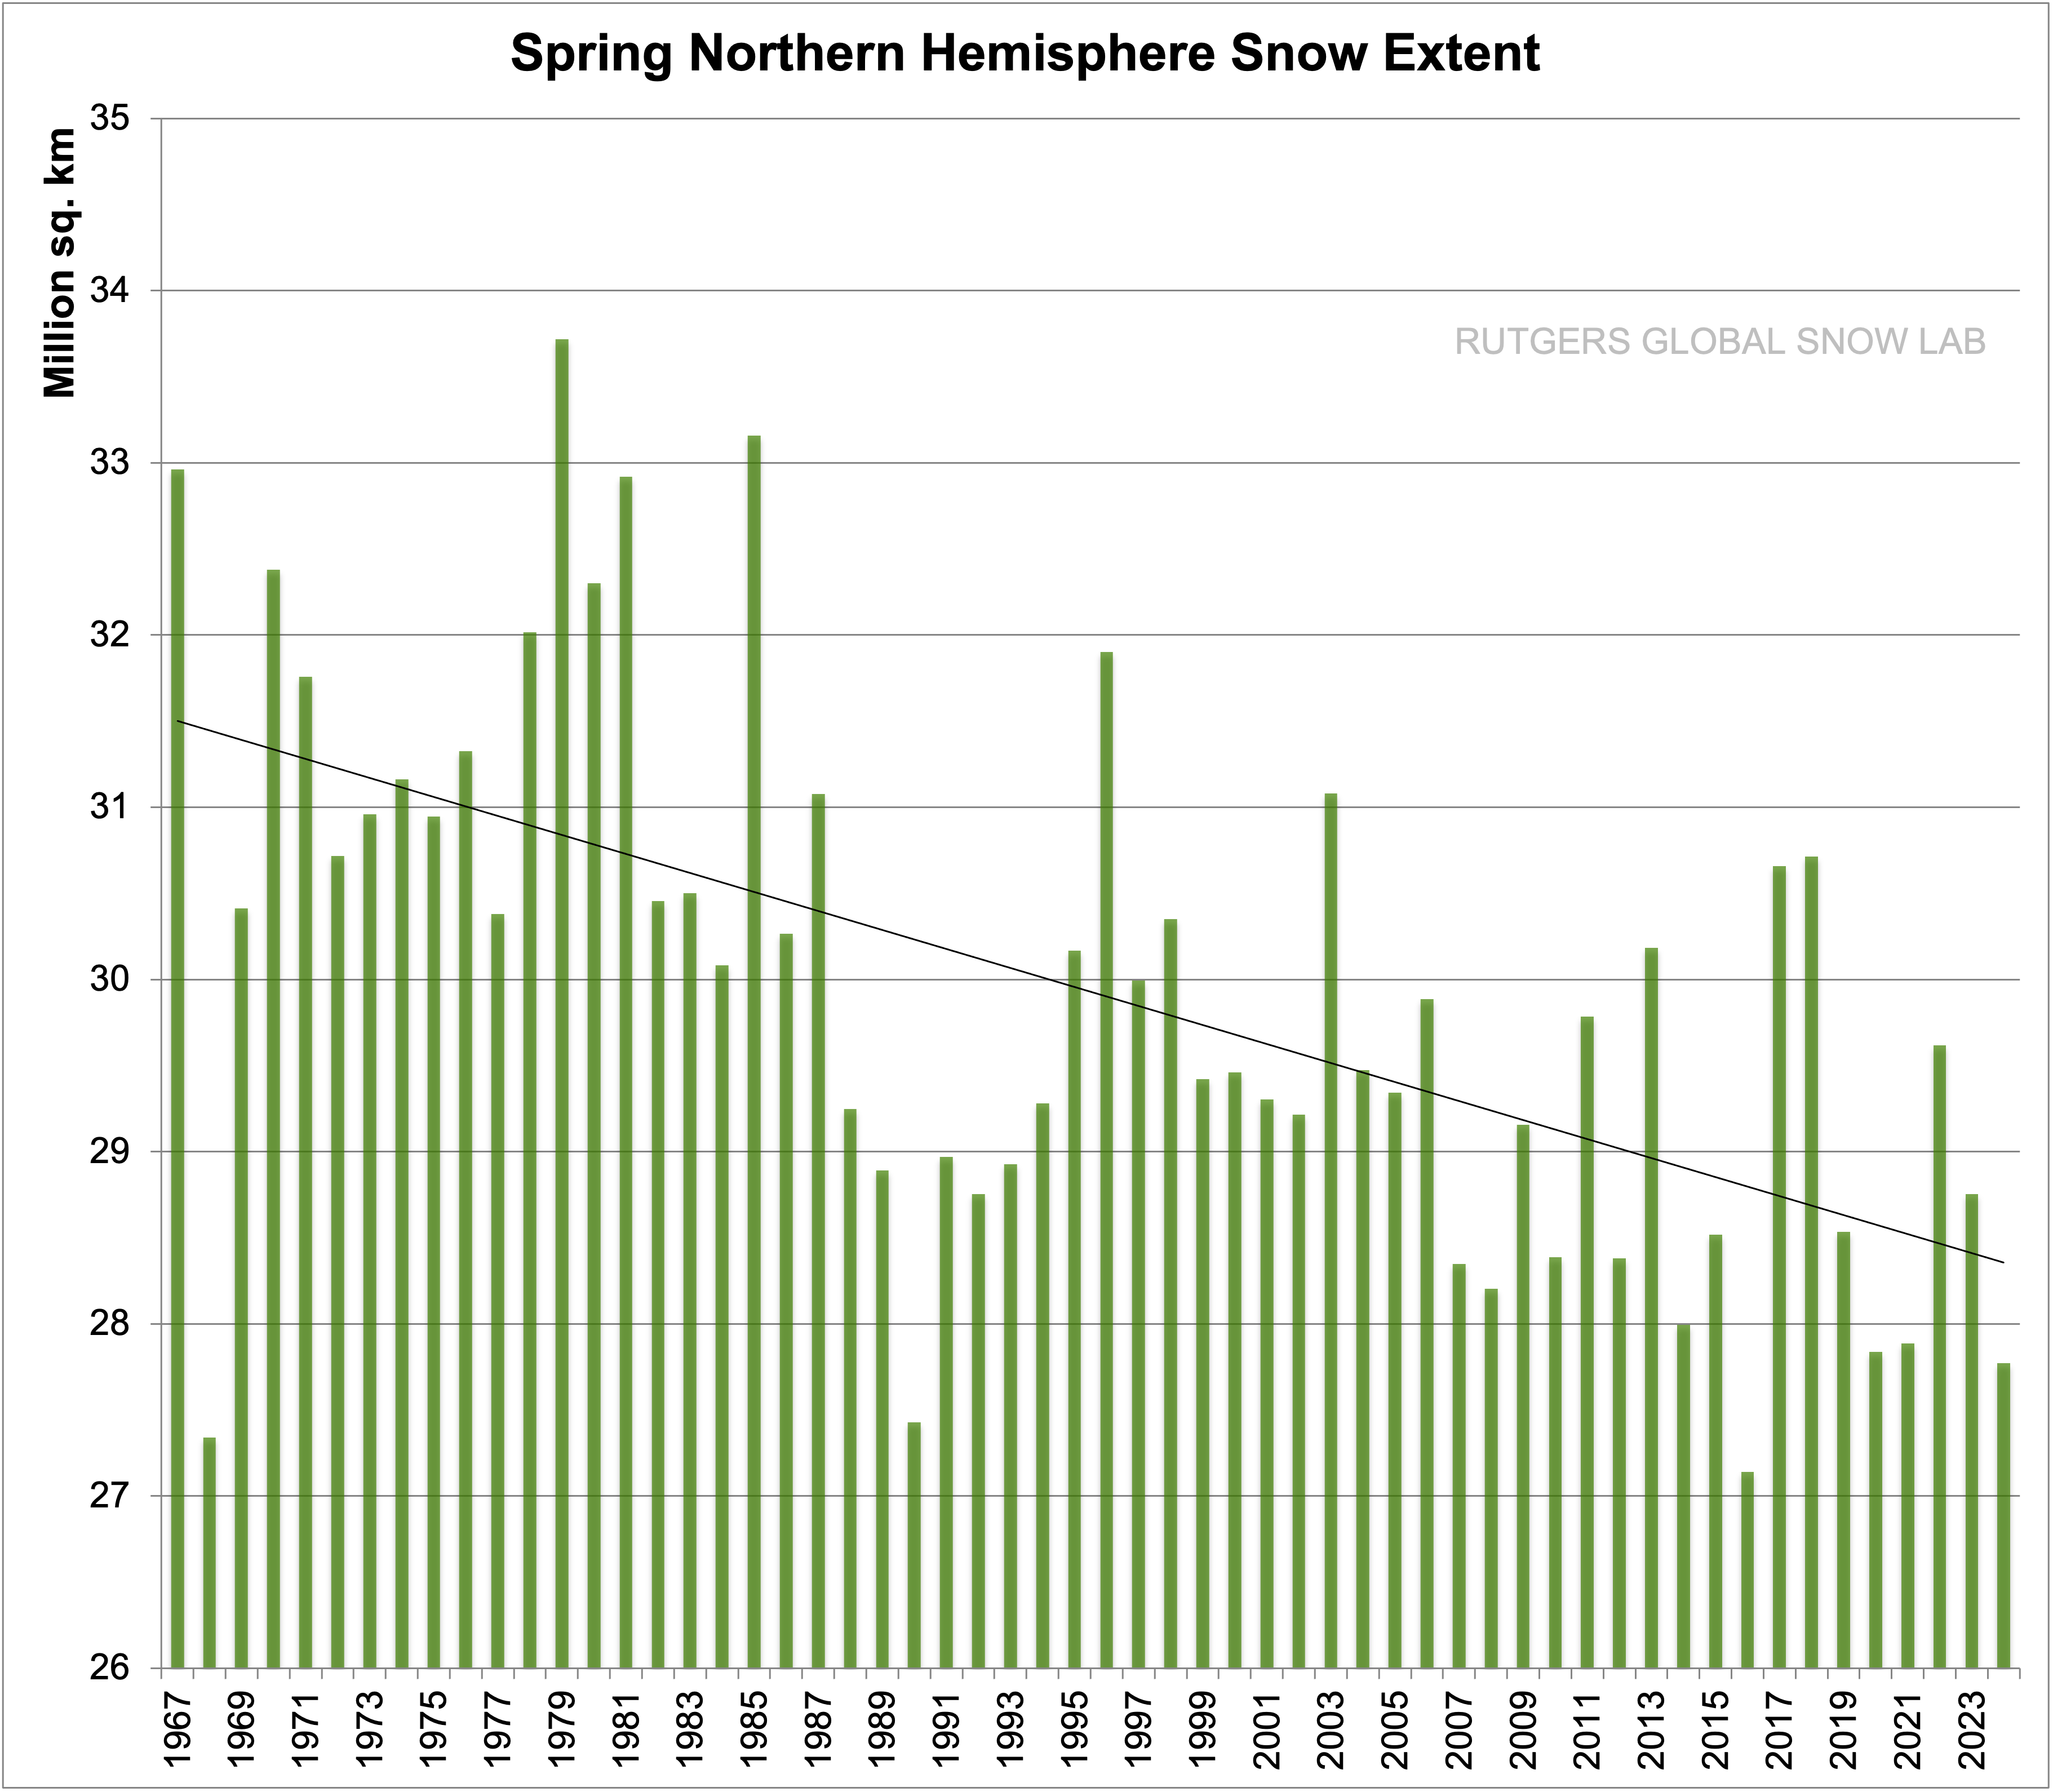
ND indicates no data for a given year.
Source: https://climate.rutgers.edu/snowcover/images/nhland_season2.png
Arctic Oscillation
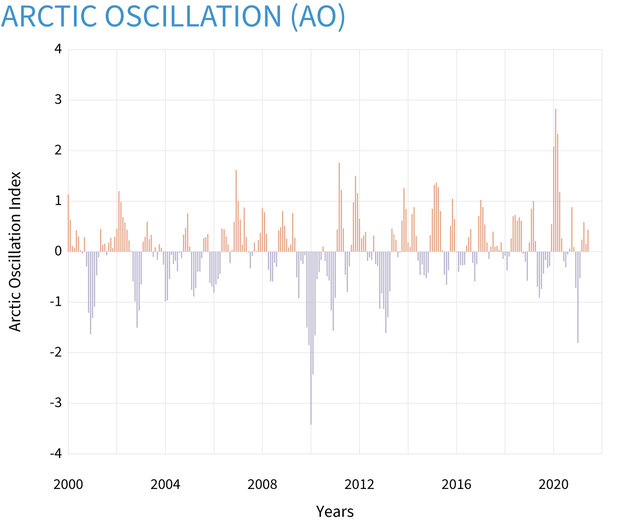
Source: https://www.climate.gov/news-features/understanding-climate/climate-variability-arctic-oscillation
Arctic Oscillation GEFS Forecasts
|
The ensemble mean forecasts of the AO index are obtained by averaging the 11 GFS ensemble members (blue lines), and the observed AO index (black line) is superimposed on each panel for comparison. For the forecasted indices (lower 3 panels), the yellow shading shows the ensemble mean plus and minus one standard deviation among the ensemble members, while the upper and lower red lines show the range of the forecasted indices, respectively. |
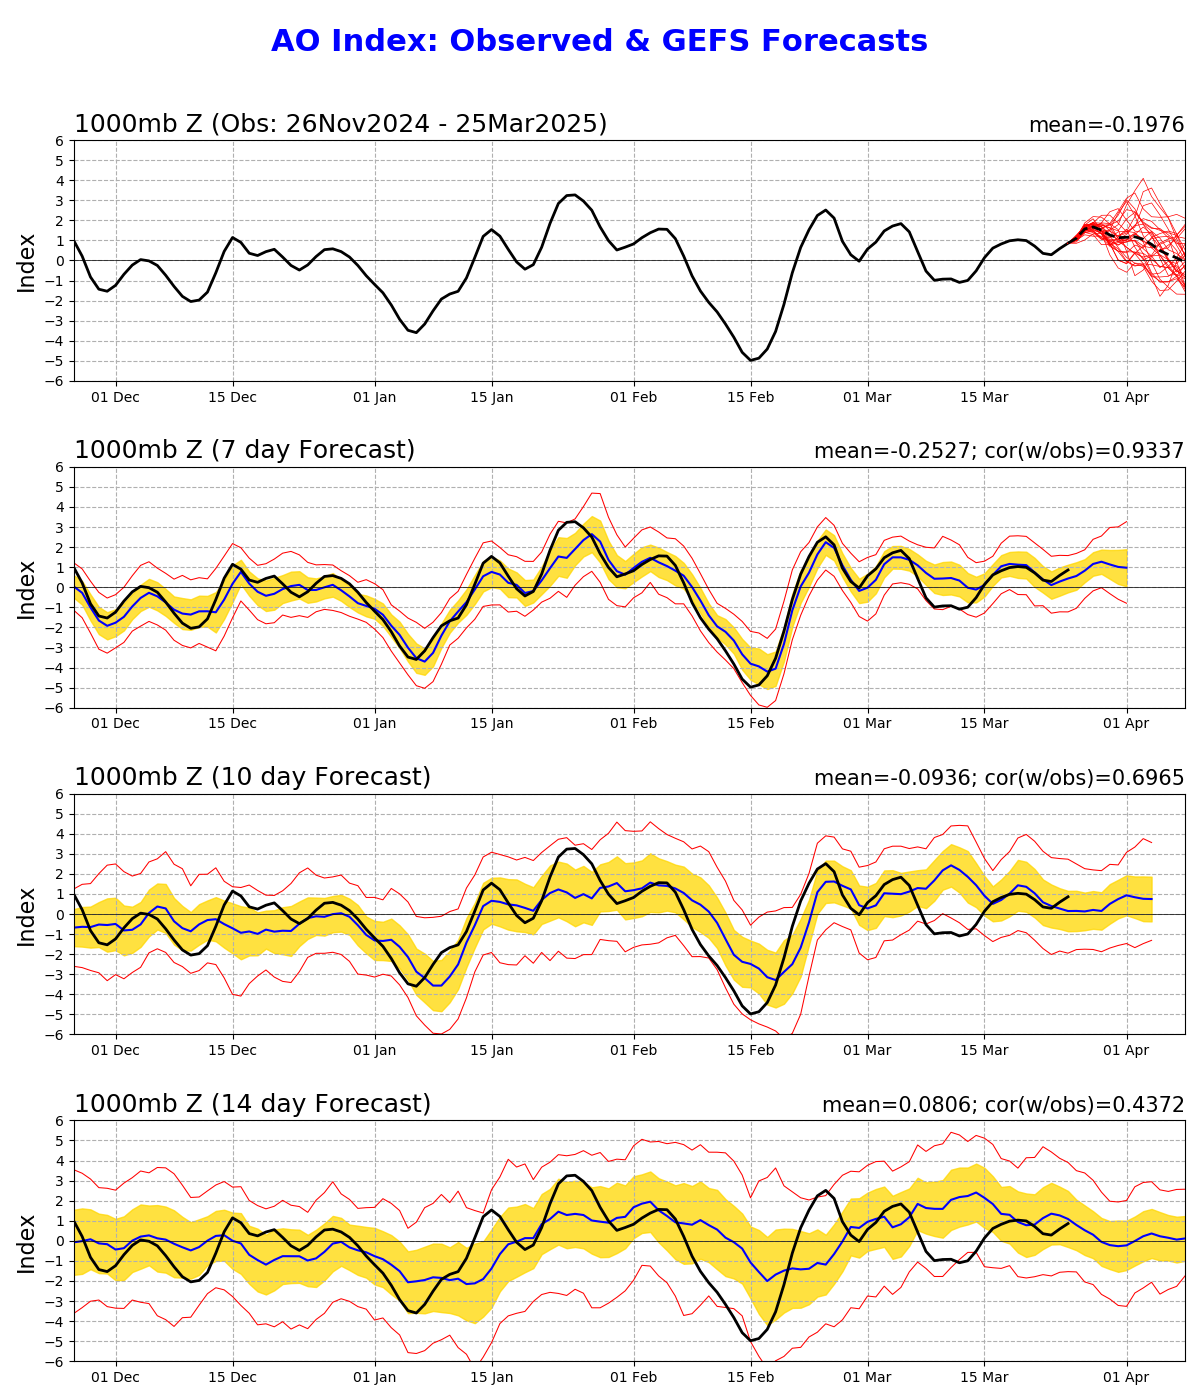 |
Source: https://www.cpc.ncep.noaa.gov/products/precip/CWlink/daily_ao_index/ao_index_ensm.shtml
MRF AO FOrecasts
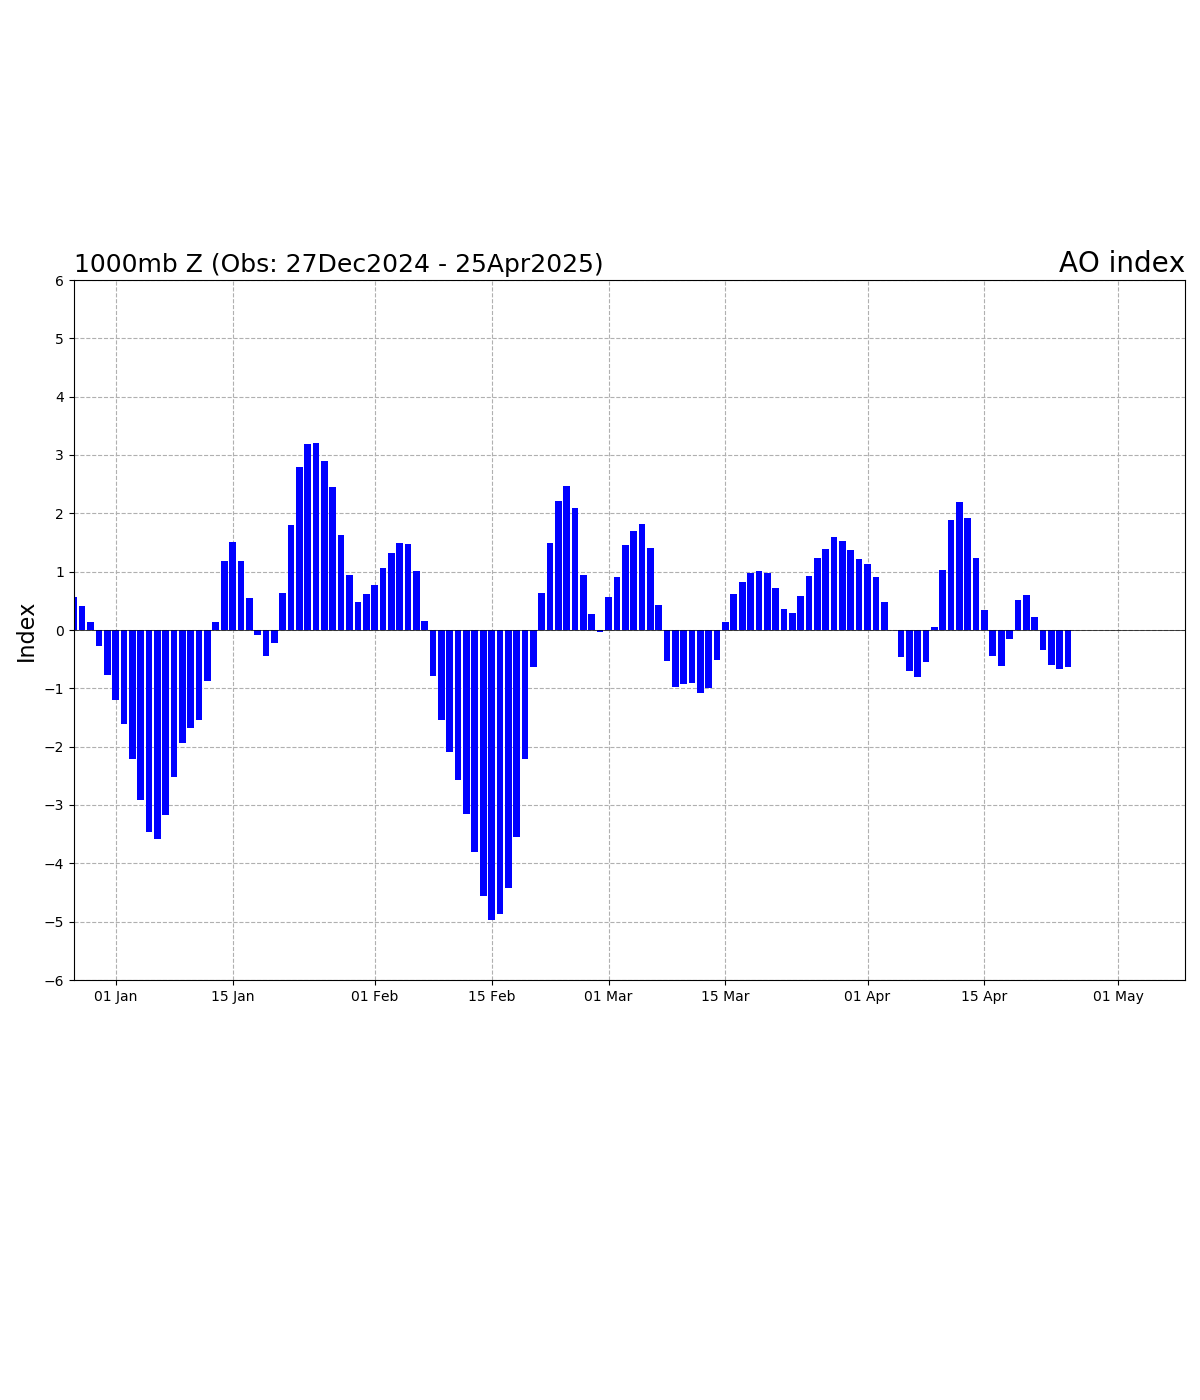 |
Source: https://www.cpc.ncep.noaa.gov/products/precip/CWlink/daily_ao_index/ao_index.html
State of Global Galciers
 Fig. 1 Annual mass balance of reference glaciers with more than 30 years of ongoing glaciological measurements. Annual mass change values are given on the y-axis in the unit meter water equivalent (m w.e.) which corresponds to tonnes per square meter (1,000 kg m-2). Source: WGMS (2021, updated and earlier reports). The data can be downloaded here.