
Current Climate Conditions
Note: This page may load slowly on low bandwidth systems. Charts are updated at different intervals (daily, monthly, annual, monthly, or semi-regular or periodic intervals. Images may not appear for various reasons, including but not limited to, source data, URL status, and server status.
| Note: Missing graphics may be due to temporary server maintenance. |
Climate affects weather. The global climate monitor shows current climate conditions in the context of current weather events. Seeing the global picture aids in how climate is perceived in the context of these weather events. The connections between natural variation combined with anthropogenic (human-caused) climate forcing allows rapid assimilation of the scope and impacts of the climate weather inter-dynamics.
TEMPERATURE
Land/Ocean and Hemisphere Global Trends
Global Mean Temperature (GMT) [updates annually]

Source: https://data.giss.nasa.gov/gistemp/graphs_v3/
Graph: https://data.giss.nasa.gov/gistemp/graphs_v3/Fig.A2.gif
Northern Hemisphere (NH), Southern (SH) Temperature Trends (GMT) [updates annually]

Source: https://data.giss.nasa.gov/gistemp/graphs_v3/
Graph: https://data.giss.nasa.gov/gistemp/graphs_v3/Fig.A3.gif
GREENHOUSE GASES
Carbon Dioxide Methane, Nitrous Oxide, CFC’s*
*Chlorofluorocarbons are Industrially produced High GWP (Global Warming Potential Gases)
Annual Greenhouse Gas Index [suspect annual update]

Source: www.esrl.noaa.gov/gmd/aggi/
Recent Mauna Loa CO2 [updates monthly]

Source: https://www.esrl.noaa.gov/gmd/ccgg/trends/

Global CO2 Emissions from Fossil-Fuel Burning, Cement Manufacture, and Gas Flaring: 1752-2006 [No auto update]

Source: https://www.epa.gov/climatechange/emissions/globalghg.html
Arctic
Arctic, Ice & Snow Trends
Arctic Ice Extent (areas with at least 15% ice coverage) [updates daily]

Source: National Snow & Ice Data Center
Graph: https://nsidc.org/data/seaice_index/images/daily_images/N_stddev_timeseries.png
Arctic Ice Extent [updates monthly]

Source: https://nsidc.org/data/seaice_index/
Spring Northern Hemisphere Snow Extent [updates annually]
Source: https://climate.rutgers.edu/snowcover/
Image: Spring Northern Hemisphere Snow Extent
Glacier Ice Mass Loss (summary 2009) [no auto update at this time]
Mean cumulative mass balance of all reported glaciers (black line) and the reference glaciers (red line).pdf
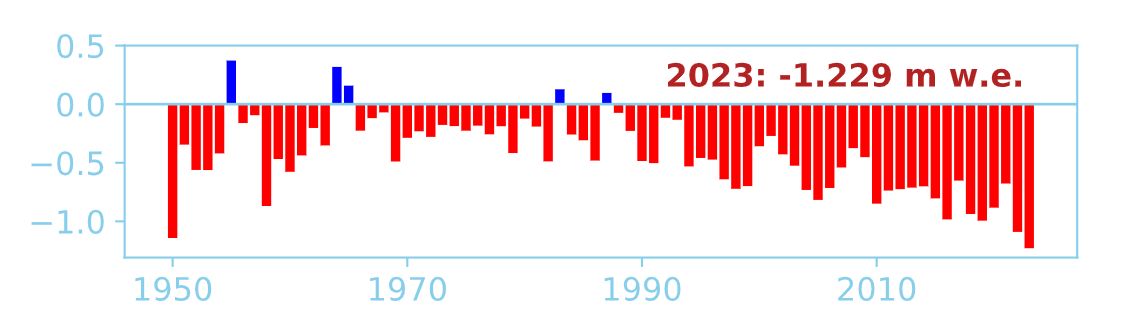
Source: https://wgms.ch
Arctic Oscillation [updates monthly]

Source: National Climate Data Center
Image: https://www1.ncdc.noaa.gov/pub/data/cmb/teleconnections/ao-5-pg.gif
Antarctic, Ice & Snow Trends
Antarctic Ice Extent Increase [updates monthly]

Source: https://nsidc.org/data/seaice_index/
Antarctic Ice Extent [updates daily]

Source: https://nsidc.org/data/seaice_index/
OCEANS
Sea Level Rise (SLR)
Topex, Jason-1, Jason-2

Source: https://sealevel.colorado.edu/
Multivariate ENSO (El Nino Southern Oscillation) Index (MEI) [updates montlhy]

Source: NOAA/ESRL (Earth System Research Laboratory)
Pacific Decadal Oscillation [updates monthly]

Source: https://www.esr.org/pdo_index.html
Sea Surface Temperature (Global Monsoon Product) [Updates Weekly]

Source: https://www.cpc.noaa.gov/products/Global_Monsoons/Global-Monsoon.shtml
Sea Surface Temperature [Updates Daily]

Source: https://polar.ncep.noaa.gov/sst/oper/Welcome.html
Image: https://polar.ncep.noaa.gov/sst/oper/global_sst_oper0.png
Sea Surface Height (US Navy) [Updates Daily]

Source: https://www7320.nrlssc.navy.mil/projects.php
Image: https://www7320.nrlssc.navy.mil/global_nlom32/
SOLAR
Sunspots, Monthly Values, 10.7cm Radio Flux
Latest Sunspot Solar Image [updates daily]

Source: https://sohowww.nascom.nasa.gov/data/realtime-images.html
Image: https://sohowww.nascom.nasa.gov/data/realtime/mdi_igr/512/
Sunspots (Smoothed with Monthly Values) [updates daily]

Source: https://www.swpc.noaa.gov/SolarCycle/
Image: https://www.swpc.noaa.gov/SolarCycle/sunspot.gif
LAND
Global Fire Maps 24 Hour/10 Day & Drought Monitoring
10 Day Segments [updates periodically 10-day intervals]
Image updates approximately every 10 days and represents the previous 10 days (approximately) from the extracted data from the MODIS Rapid Response System Global Fire Maps:

Static links for latest firemaps: Dates 600×300 2048×1024 4096×2048 8192×4096
Source: NASA/GSFC, MODIS Rapid Response.
Global Drought Monitoring