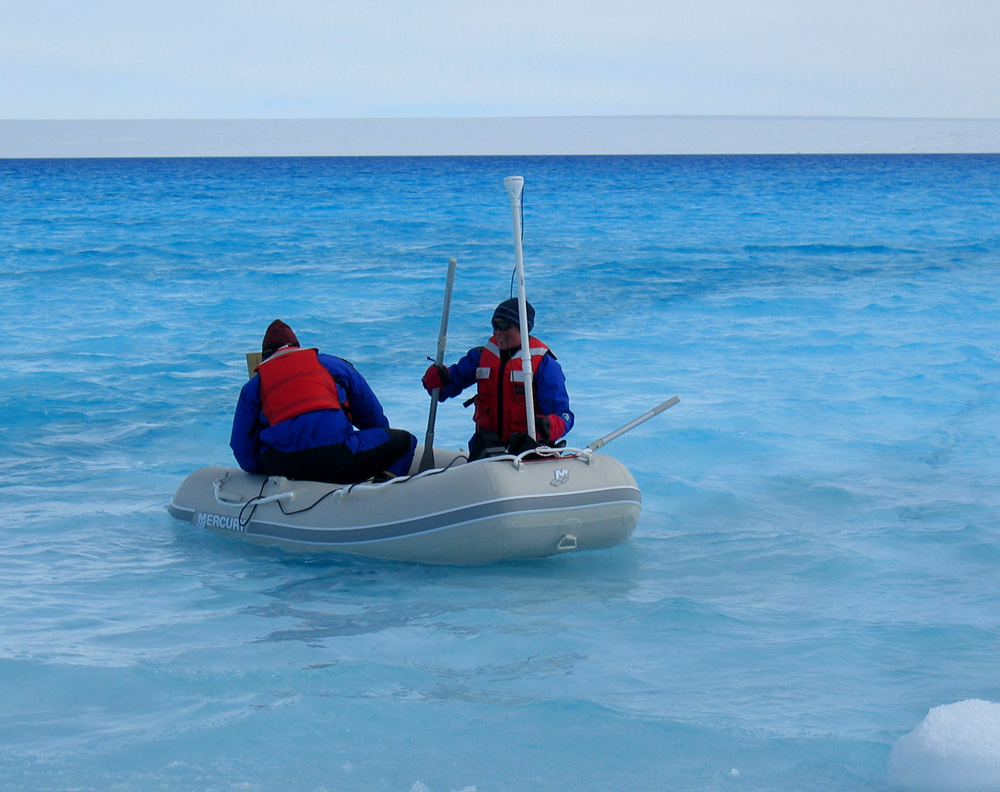
Greenland Ice Melt
The ice is melting in Greenland. The ice melt rate is also accelerating. What does this mean? That depends on your context in time, your geographic location, and ultimately, why it is happening?
The Greenland ice sheet covers more than 20,000 square miles and is generally 2 to 3km thick (1.2 to 1.8 miles).
The ‘glacial pace’ is the speed of advancing or retreating ice sheets. Typically, in the past, this has been measured in inches per day, or feet per year.
Direct observations of the ice shows that the speed of the glacial pace is increasing. This is of course expected in a warming world. If we were in the natural cycle and experiencing normal natural variation, the glacial pace would still be observed in inches per day, or feet per year. But that is not the case.
Climate change caused by global warming has accelerated the pace and ‘some’ glaciers are now surging at 20 meters (65 feet) per day.
Note: While ice sheet movement is accelerating, not all areas are seeing such a dramatic increase. The context here is that the ice sheet movement is accelerating and the rates are expected to increase, which will result in accelerated sea level rise that will increasingly impact human settlements near sea level.
Greenland is Melting
The Greenland ice sheet is massive and even these accelerations are not expected to be immediately devastating when looked at in consideration of sea level rise. However, the speed is accelerating and is expected to continue to accelerate. This will be a serious problem for cities located in low lying areas.
Large human populations live in such areas that will be affected such as Bangladesh, Beijing, Miami and New York.
The cost will be relative to the rate of sea level rise and the amount of infrastructure affected as well as natural and enhanced coastal weather events occurring based on natural variability and climate change related to anthropogenic global warming. Ocean heat content and especially ocean surface heat is an important factor in some regions as that can translate to increased storm strength/intensity.
Disaster
Depends on your perspective? Do you live in, or own property, in low lying areas near sea level? What is your investment horizon? How easy it is for you to move? If you own a house or a building on the coast, how much can you get for it if people know it will end up in the water? If you have a job in a low lying area where will your place of employment go?
When people begin to move, what will that mean for other regions that are already populated. How will the other regions cope with increasing population? There will be new resource issues regarding food, housing, energy, governance and related societal issues.
A clue can be found in properties near San Francisco. In 2008 someone said he found a great house with a 270 degree view of the Pacific for only $500k. When asked, why is it so cheap? He said, because all the other houses had fallen into the ocean during the last El Nino. Property values are linked to the risk/reward of coastal events and soon SLR will become a factor as well, based on time horizon.
What does disaster mean?
The sea level will rise (SLR). Leading quantitative studies indicate SLR will rise 2 meters by 2100. Qualitative assessments indicate potentials for 5 meters by or around 2100. It is reasonable to say at this point that the oceans will rise around 2 meters, but positive feedback mechanisms which are occurring are still being examined to determine degrees of potential for higher SLR.
Millions of people will have to move.
Sea level rise is a compounding problem and it is accelerating. So it’s degree of impact will start slowly and increase with time over decades.
The main contributions to SLR include ice sheet melt, glacial melt, and thermal expansion of the water due to warming oceans.
Links
- Related content
- Sea Level Rise
- Arctic Ice Melt
- Antarctic Ice Melt

