2009 – Sea Level Rise Research Summary (last update 4/2013)
How to reconcile the strict limitations of scientific method with reasonable expectations based on probability and risk have confounded the human-caused global warming (AGW) argument. The reality is sea level will rise. However, there are other oceanic forces that will have economic consequences prior to major sea level rise. Storm strength, droughts, flooding, crop yields and thermal limits are also important considerations. Note: Tad Pfeffer has responded in an update to this report on September 15th regarding SLR above 5 meters: “…we believe it is reasonable to ponder very high rates of SLR in the next century. However, we also believe that it is problematic to project such a ‘hypothesis’ as a supported theory without proper testing by the scientific method.”
- Contents
-
- SUMMARY
- TIPPING POINTS:
- Sea Level Rise
- Alternative Theory for Negative Forcing
- Sea Surface and Global Mean Temperatures
- Summary
- UPDATE: September 2007 – 2.5 feet to 2 meters by 2100 v. 5 meters by 2100
- Additional Materials
- About scientists whose material is included in this report:
- Report prepared by:
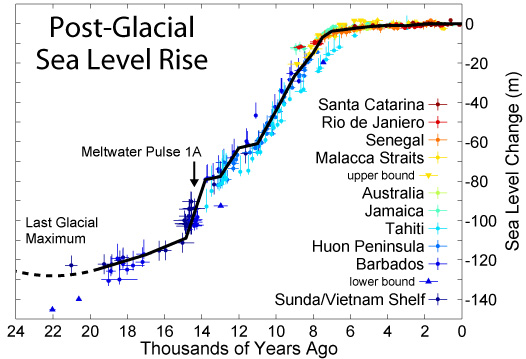
Source: https://oceanexplorer.noaa.gov/explorations/09newworld/background/occupation/media/post_glacial.html
Sea level rise since the last glacial episode. Image courtesy of Exploring the Submerged New World 2009 Expedition, Robert A. Rohde, Global Warming Art, NOAA-OER.
Related Links
Exploring the Submerged New World 2009
Exploring the Submerged New World 2009: Early Human Occupation
This report addresses reasonable assumptions based on what is well understood and therefore addresses that which has a reasonable potential of occurrence. The response mechanisms are considered to be possibly non linear in nature and the paleo records indicate that hypothesized negative feedback mechanisms have not halted past warmings.
A reasonable conclusion leans toward the likelihood of sea level rise above the AR4 estimations but also likely less than extreme scenarios of 5 meters SLR by 2100. This paper is a summary of the science combined with reasonable potentials that may be derived from the current understanding of climate system response.
Understanding influences on Sea Level Rise:
- Global sea-level rise is the average increase in the level of the world’s oceans that occurs due to a variety of factors, the most significant being thermal expansion of the oceans and the addition of water by melting of land-based ice sheets, ice caps, and glaciers.
- Relative sea-level rise refers to the change in sea level relative to the elevation of the adjacent land, which can also subside or rise due to natural and even some human-induced factors which may alter coastal deposition of land based silt. Relative sea-level changes include both global sea-level rise and changes in the vertical elevation of the land surface.
- Land Subsidence’ refers to to land lowering in elevation due to subsurface water or oil extraction.
- Rebounding refers to land rising due to decreased pressure that can be caused by ice melt or glacial retreat.
- Tectonic activity refers to land rise or fall due to tectonic movement.
Is the rate of sea level rise accelerating?
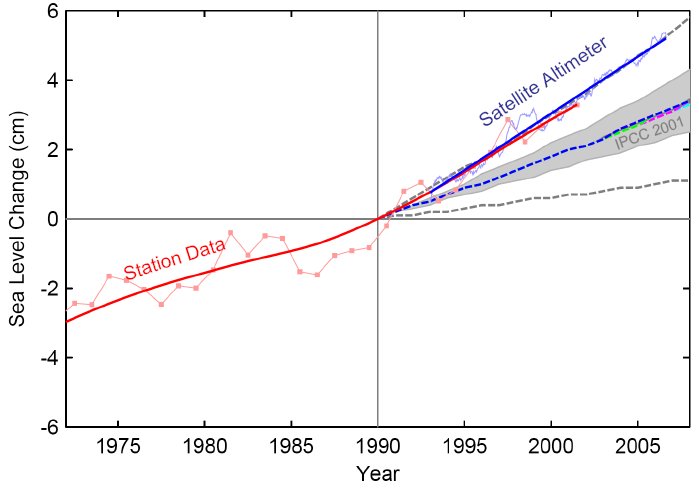
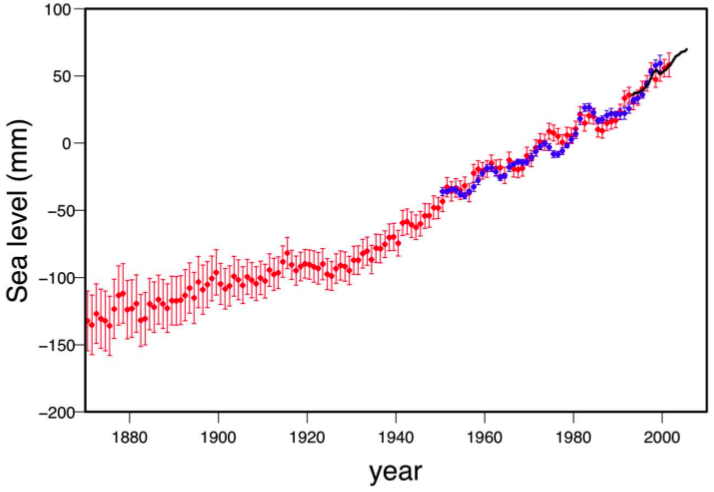
- The IPCC expresses high confidence that the rate of observed sea level rise increased from the mid 19th to the mid 20th century. During the 20th century, sea level rose at an average rate of 4.8 to 8.8 inches per century (1.2-2.2 mm/year). (IPCC, 2007)
- Tide gauges show little or no acceleration during the 20th century.
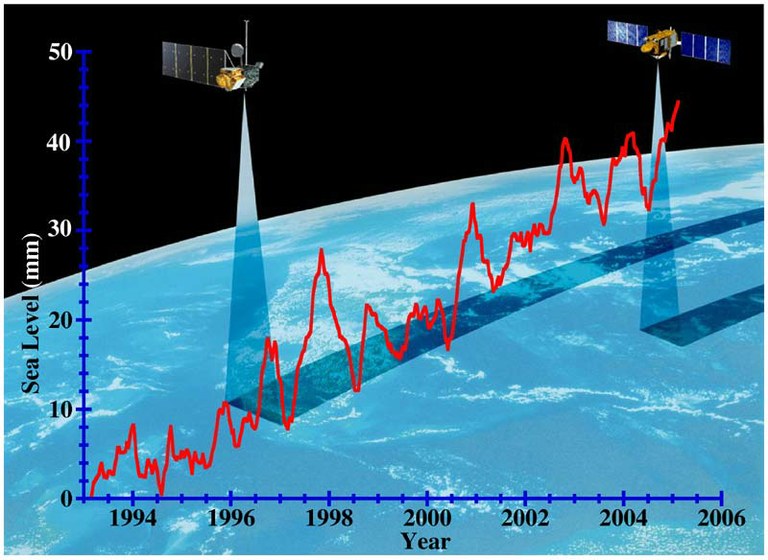
- Satellite measurements estimate that sea level has been rising at a rate of 9 to 15 inches per century (2.4-3.8 mm/yr) since 1993, more than 50% faster than the rate that tide gauges estimate over the last century. (IPCC, 2007)
SUMMARY
What we know.
- Sea level will rise (reasonable confidence on 1-2 meters by 2100).
- The most immediate ocean based risk is likely to derive from storm damage cased by stronger storms and related flooding.
- Sea level will likely increase economic stressors in the coming century. The costs to coastal infrastructure will add to the overall economic stressors from other areas that are expected to be inter-dynamically connected to climate change.
What we don’t know.
- The speed of rise based on apparently accelerating positive feedbacks in the climate system. How much faster?
- The amount of sea level rise by 2100 has reasonable potential to be higher than currently estimated in the AR4 report. How much higher?
- The climate sensitivity may be higher than models currently indicate. How much higher?
Sea Level Rise (SLR) Estimations
As scientific awareness increased regarding global warming in the 70’s and 80’s additional funds were committed to learning more about our environment, its functions, and what influences climate.
What affects sea level rise.
- Thermal expansion: It is estimated that up to half of the sea level rise is attributable to thermal expansion. As the ocean warms, it expands, thus increasing sea level.
- Ocean temperature continuing to increase. [in 2006 there was data suggesting that the oceans began to cool. It was later found the trend was continuing to warm (view NASA review of the analysis)]
- Ice melt from Arctic and glacial sources are already contributing to about half of the sea level rise. Antarctica is likely to begin contributing more in the future. But when is not yet strongly known.
Recent infrared satellite imagery reveals winter break up of the Wilkins Ice shelf; an unexpected event. This indicates the possibility of acceleration beyond what has been expected up until now.
Scientifically
- Scientifically, this question can not be answered with any strong degree of confidence beyond the empirical understanding. That does not mean the question can not be addressed with methods of reasoning based on evidence and understanding of climate forcings and dynamics.
Problems
- The problem with realistically assessing SLR is that key factors still need to be better understood. That which is unknown by science is not included, which tends to result in a potentially unrealistically conservative scientific view.
- Therefore the scientific analysis of SLR may yield conservative estimates of mostly linear processes and a potentially more realistic projection ‘may’ be less scientific and more considerate of probabilities while containing a wider range of uncertainty. So reality, or what will happen, is not as well understood in certain areas of the analysis.
- Science measures and then estimates. In the case of realistically estimating SLR, prescience is required in order to understand reasonably likely potentials. At the same time, guessing is not science. This is better understood in in risk analysis more like that used to model insurance actuary tables. Weighing the risk probability to economic loss potentials gives us a better way to consider relevance and uncertainty regarding seal level rise.
The Problem of Understanding Projections
Dr. Gavin Schmidt: “People don’t seem to embrace global measures of temperature rise (~0.2ºC/decade) or sea level rise (> 3mm/yr) very strongly. They much prefer more iconic signs – The National Park formerly-known-as-Glacier, No-snows of Kilimanjaro, Frost Fairs on the Thames etc. As has been discussed here on many occasions, any single example often has any number of complicating factors, but seen as part of a pattern (Kilimanjaro as an example of the other receding tropical glaciers), they can be useful for making a general point. However, the use of an icon as an example of change runs into difficulty if it is then interpreted to be proof of that change.”
Dr. Gavin Schmidt: “With respect to sea level, the Thames Barrier is a concrete example that has been frequently raised.”
Dr. Gavin Schmidt: “The trends in its ‘raising’ have been linked to increasing sea levels and storm surges. But how often is it being raised? why? and does it give us any real insight into sea level rises on a wider basis? Looking into it, I was fortunate to get an exceptionally comprehensive set of data on the closings and reasons for them from Anthony Hammond at the Environment Agency in the UK. The results are interesting, but complicated….”
Dr. Gavin Schmidt: “It is clear there has been a strong upswing in closings over time. The last year alone there were almost 3 times as many closing as during the first 5 years of operation put together. The three-year running mean is possibly a little clearer, showing two definite periods of more frequent closings, 1992 to 1995 and 2002 to the present.”
Dr. Gavin Schmidt: “Is this a sign of increased sea level, increased storminess, increased river flow, or changes in river management policy? As always, local factors in short records are important. Over the two and half decades of barrier operation, understanding of the Thames river hydrology has grown and models are now more accurate than they used to be, allowing for more precision in decisions to raise the barrier. The decisions depend on three main factors, the river flow at Teddington (which is where the first weir is), the forecast high tide and the (more uncertain) accompanying surge. Thus if the river flow is strong, an unexceptional high tide could cause problems, while even an exceptional tide might not if the river is particularly low. In the data, closings are distinguished by whether they are due to tidal issues, or to the combined effect of tides and high river flow (fluvial), but there is not necessarily a clean distinction.”
Source: Real Climate – A Barrier to Understanding

NCDC (National Climate Data Center)

https://lwf.ncdc.noaa.gov/oa/climate/research/2008/jul/global.html#temp
The GHG (Greenhouse Gas) Change Rate
The GHG change rate weighed against the natural cycle, as observed from the paleo record, is estimated at between 7,000 and 14,000 times the natural variability rate so we are in unprecedented territory, therefore using paleo records to predict SLR rise rates fails. We are in new territory.
The IPCC estimates are the most conservative and do not include the non linear response mechanisms already perceptible in the observations, but not verifiable due to a lack of comparative data. This is due to the first problem above that we are in new territory and therefore can not compare existing changes with high validity, to the paleo record as understood.
IPCC AR4 Report summary for policy makers issued in November, 2007
The sea level rise rate has accelerated as expected. Each climate tipping point may or is expected to further increase the rate of sea level rise.
TIPPING POINTS:
Tipping Points Report Source:
A group of US, British and German climate scientists compiled a report the the National Academy of Sciences describing the problems associated with expected tipping points. The tipping points will affect major aspects of accelerated climate change as well as ecosystems.
Source: https://www.msnbc.msn.com/id/23011346/
Highly sensitive, smallest uncertainty
Greenland Ice Sheet (more than 300 years):
“Warming over the ice sheet accelerates ice loss from outlet glaciers and lowers ice altitude at the periphery, which further increases surface temperature … The exact tipping point for disintegration of the ice sheet is unknown, since current models cannot capture the observed dynamic deglaciation processes accurately. But in a worst case scenario local warming of more than three degrees Celsius could cause the ice sheet to disappear within 300 years. This would result in a rise of sea level of up to seven meters.”
Arctic sea-ice (approximately 10 years):
The National Snow and Ice Data Center has revised their estimates recently to 5-7 years. Current trends indicate 4-5 years the north pole will be ice free in summer.
“As sea-ice melts, it exposes a much darker ocean surface, which absorbs more radiation than white sea-ice so that the warming is amplified. This causes more rapid melting in summer and decreases ice formation in winter. Over the last 16 years ice cover during summer declined markedly. The critical threshold global mean warming may be between 0.5 to 2 degrees Celsius, but could already have been passed. One model shows a nonlinear transition to a potential new stable state with no arctic sea-ice during summer within a few decades.”
Intermediately sensitive, large uncertainty
West Antarctic Ice Sheet (more than 300 years):
“Recent gravity measurements suggest that the ice sheet is losing mass. Since most of the ice sheet is grounded below sea level the intrusion of ocean water could destabilize it. The tipping point could be reached with a local warming of five to eight degrees Celsius in summer. A worst case scenario shows the ice sheet could collapse within 300 years, possibly raising sea level by as much as five meters.”
Boreal forest (approximately 50 years):
“The northern forests exhibit a complex interplay between tree physiology, permafrost and fire. A global mean warming of three to five degrees Celsius could lead to large-scale dieback of the boreal forests within 50 years. Under climate change the trees would be exposed to increasing water stress and peak summer heat and would be more vulnerable to diseases. Temperate tree species will remain excluded due to frost damage in still very cold winters.”
Amazon rainforest (approximately 50 years):
Current reports indicate the loss of the rainforest within 20-30 years. The region is expected to convert to a Savannah like ecosystem.
“Global warming and deforestation will probably reduce rainfall in the region by up to 30 percent. Lengthening of the dry season, and increases in summer temperatures would make it difficult for the forest to re-establish. Models project dieback of the Amazon rainforest to occur under three to four degrees Celsius global warming within fifty years. Even land-use change alone could potentially bring forest cover to a critical threshold.”
El Niño Southern Oscillation (approximately 100 years):
The 1998 El Nino event was the strongest in history. Since the climate system is warming the amplitude will be increased by virtue of the fact it is occurring on a stronger trendline.
“The variability of this ocean-atmosphere mode is controlled by the layering of water of different temperatures in the Pacific Ocean and the temperature gradient across the equator. During the globally three degrees Celsius warmer early Pliocene ENSO may have been suppressed in favor of persistent El Niño or La Niña conditions. In response to a warmer stabilized climate, the most realistic models simulate increased El Niño amplitude with no clear change in frequency.”
Africa rainfall (approximately 10 years):
“The amount of rainfall is closely related to vegetation climate feedback and sea surface temperatures of the Atlantic Ocean. Greenhouse gas forcing is expected to increase Sahel rainfall. But a global mean warming of three to five degrees Celsius could cause a collapse of the West African monsoon. This could lead either to drying of the Sahel or to wetting due to increased inflow from the West. A third scenario shows a possible doubling of anomalously dry years by the end of the century.”
Indian summer monsoon (approximately 1 year):
The National Climate Data Center is already reporting that observations indicate this is now occurring.
“The monsoon circulation is driven by a land-to-ocean pressure gradient. Greenhouse warming tends to strengthen the monsoon since warmer air can carry more water. Air pollution and land-use that increases the reflection of sunlight tend to weaken it. The Indian summer monsoon could become erratic and in the worst case start to chaotically change between an active and a weak phase within a few years.”
Lowly sensitive, intermediate uncertainty
Atlantic thermohaline circulation (approximately 100 years):
NASA has released a report showing that the thermohaline circulation is showing signs of slowing, but trend analysis is still preliminary.
“The circulation of sea currents in the Atlantic Ocean is driven by seawater that flows to the North Atlantic, cools and sinks at high latitudes. If the inflow of freshwater increases, e.g. from rivers or melting glaciers, or the seawater is warmed, its density would decrease. A global mean warming of three to five degrees Celsius could push the element past the tipping point so that deep water formation stops. Under these conditions the North Atlantic current would be disrupted, sea level in the North Atlantic region would rise and the tropical rain belt would be shifted.”
END MSNBC REPORT
Tipping Point Indicators
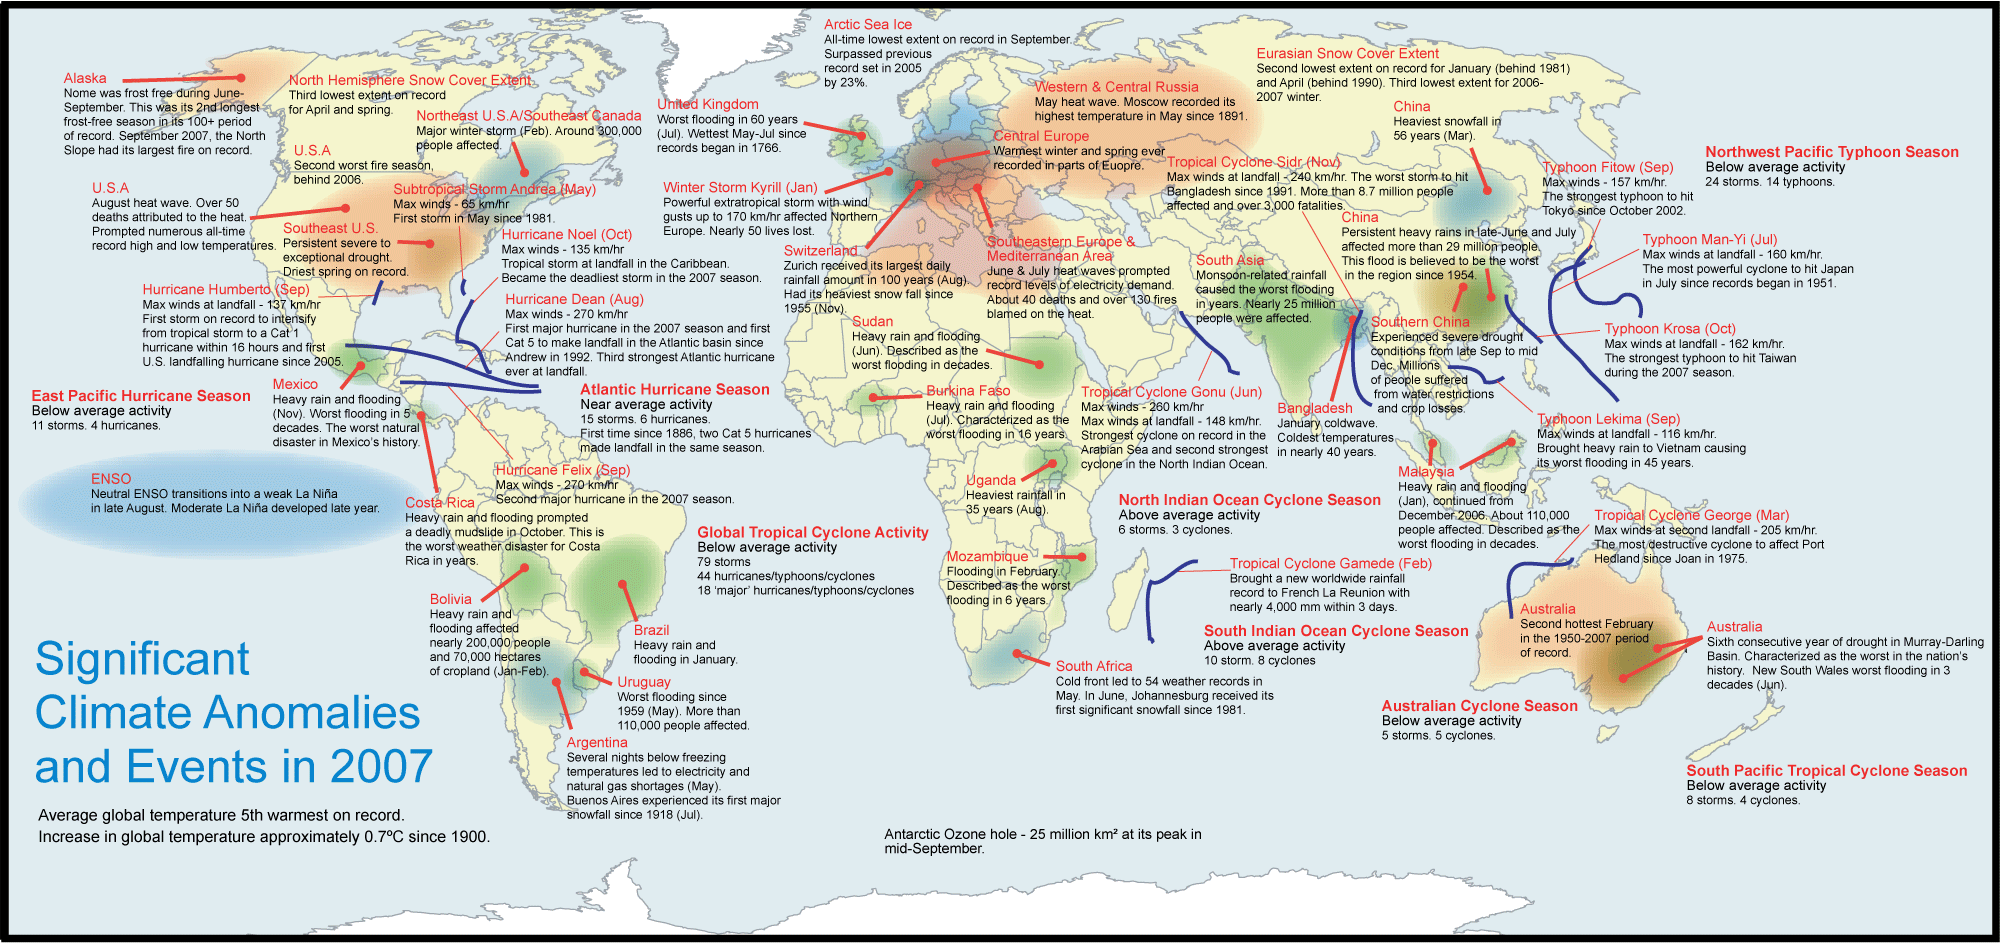
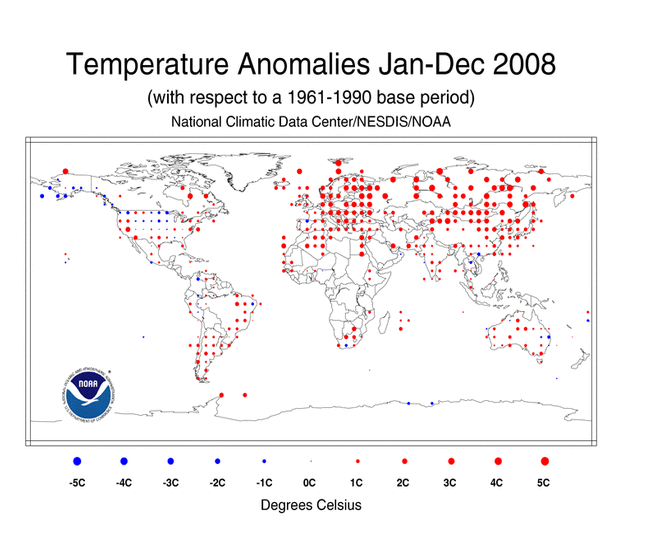
The National Climate Data Center has been tracking increased intensity in global climate related events. These events are considered anomalies.
Significant Climate Anomalies – NOAA
By tracking significant anomalies we are better able to establish trends in climate change related to the current global warming event.
Additional Uncertainty in Estimating Sea Level Rise
Calculating potential SLR is extremely complex and there are significant uncertainties.
Professor Stephan Ramstorf: “Although a full physical understanding of sea-level rise is lacking, the uncertainty in future sea-level rise is probably larger than previously estimated. A rise of over 1 m by 2100 for strong warming scenarios cannot be ruled out, because all that such a rise would require is that the linear relation of the rate of sea-level rise and temperature, which was found to be valid in the 20th century, remains valid in the 21st century. On the other hand, very low sea-level rise values as reported in the IPCC TAR now appear rather implausible in the light of the observational data.”
Article: Science Magazine – A Semi-Empirical Approach to Projecting Future Sea-Level Rise
Sea Level Rise
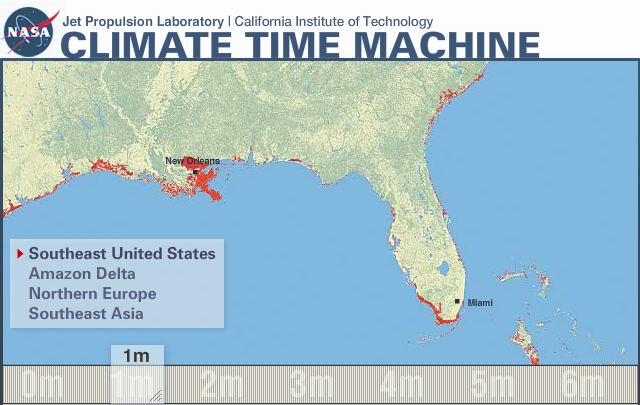
NASA/JPL – As sea level rises, beaches shrink.
JPL Sea Level Satellite Measurement Reports
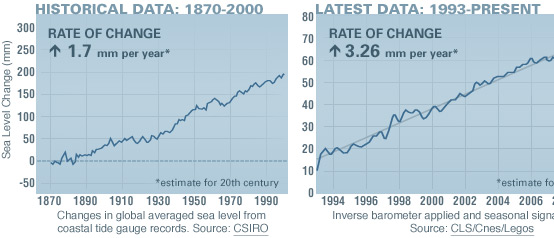
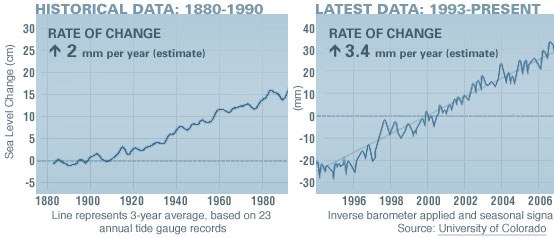
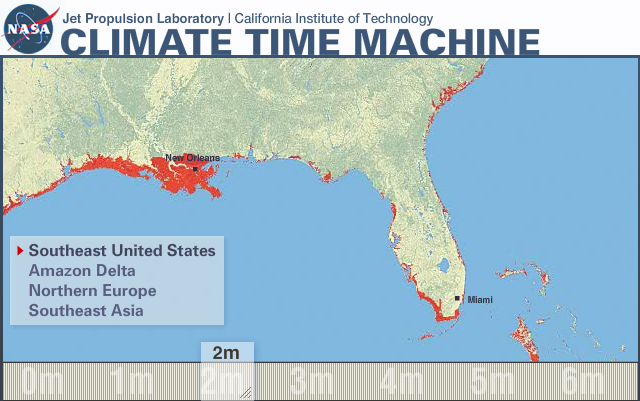
Satellites are now used to measure sea level as well as standard measurement techniques. The Jet Propulsion Laboratory has set up a page to track global climate change. On the key indicators page you can see the changes between the sea level rise rates of 1880-1990 and the right chart showing 1993 to present.
JPL Sea Level Rise
https://climate.jpl.nasa.gov/keyIndicators/
The rate of sea level rise has increased from an estimated 2mm per year to and estimated 3.4 mm per year. In consideration of known forcings and current understanding of feedback mechanisms it is estimated that this rate shall continue to increase as climate forcing increases and feedback mechanisms come into play.
- SLR is estimated to have risen at least 6 inches since 1880
- SLR is estimated to have risen at least 2 inches since 1990
At the current rate we have seen a 50mm (5 cm)sea level rise since 1992. The current rate is 3.4 cm per decade.
The Case For at least 59cm SLR (About 2 Feet)
SCIENTIFIC ANALYSIS – Confidence = High
The IPCC Sea Level Numbers
Professor Stephan Ramstorf: The sea level rise numbers published in the new IPCC report (the Fourth Assessment Report, AR4) have already caused considerable confusion. Many media articles and weblogs suggested there is good news on the sea level issue, with future sea level rise expected to be a lot less compared to the previous IPCC report (the Third Assessment Report, TAR). Some articles reported that IPCC had reduced its sea level projection from 88 cm to 59 cm (35 inches to 23 inches) , some even said it was reduced from 88 cm to 43 cm (17 inches), and there were several other versions as well (see “Broad Irony”). These statements are not correct and the new range up to 59 cm is not the full story.
IPCC AR4 2007: Models used to date do not include uncertainties in climate-carbon cycle feedback nor do they include the full effects of changes in ice sheet flow, because a basis in published literature is lacking. The projections include a contribution due to increased ice flow from Greenland and Antarctica at the rates observed for 1993-2003, but these flow rates could increase or decrease in the future. For example, if this contribution were to grow linearly with global average temperature change, the upper ranges of 10sea level rise for SRES scenarios shown in Table SPM-3 would increase by 0.1 m to 0.2 m. Larger values cannot be excluded, but understanding of these effects is too limited to assess their likelihood or provide a best estimate or an upper bound for sea level rise.
Real Climate Review of IPCC Numbers – 2007
The Case For at least .5 to 1.4 Meters
SCIENTIFIC ANALYSIS – Confidence = High
A Semi-Empirical Approach to Projecting Future Sea-Level Rise
January 19, 2007 Stefan Ramstorf: A semi-empirical relation is presented that connects global sea-level rise to global mean surface temperature. It is proposed that, for time scales relevant to anthropogenic warming, the rate of sea-level rise is roughly proportional to the magnitude of warming above the temperatures of pre–Industrial holocene. This holds to good approximation for temperature and sea-level changes during the 20th century, with a proportionality constant of 3.4 millimeters/year per °C. When applied to future warming scenarios of the Intergovernmental Panel on Climate Change, this relationship results in a projected sea-level rise in 2100 of 0.5 to 1.4 meters above the 1990 level.
Download PDF: https://www.pik-potsdam.de/~stefan/Publications/Nature/rahmstorf_science_2007.pdf
The Case For at least .8 to 2 Meters
SCIENTIFIC ANALYSIS – Confidence = Medium/High
Kinematic Constraints on Glacier Contributions to 21st-Century Sea-Level Rise
September 5, 2008 W. T. Pfeffer, J. T. Harper, S. O’Neel: On the basis of climate modeling and analogies with past conditions, the potential for multimeter increases in sea level by the end of the 21st century has been proposed. We consider glaciological conditions required for large sea-level rise to occur by 2100 and conclude that increases in excess of 2 meters are physically untenable. We find that a total sea-level rise of about 2 meters by 2100 could occur under physically possible glaciological conditions but only if all variables are quickly accelerated to extremely high limits. More plausible but still accelerated conditions lead to total sea-level rise by 2100 of about 0.8 meter. These roughly constrained scenarios provide a “most likely” starting point for refinements in sea-level forecasts that include ice flow dynamics.
1 Institute of Arctic and Alpine Research, University of Colorado, Boulder, CO 80309, USA.
2 Department of Geosciences, University of Montana, Missoula, MT 59812, USA.
3 Scripps Institution of Oceanography, University of California San Diego, San Diego, CA 92093, USA.
Note: The following case (5 meter) address conceivable potentials based on current understanding of the paleo record and the current level of reasonable understanding of constraints v. potentials. The main differences are that in our current scenario (Anthropogenic Global Warming) Black Soot has been introduced due to human industrial processes, This is expected to act as an accelerator to ice sheet melt rates. Land use changes are also contributing to dynamic changes in the climate system. All systems affect each other, so that is where the main questions remain. That is, what will result from these dynamic interactions and feedback systems?
https://www.nasa.gov/vision/earth/environment/arctic_soot.html
https://www.giss.nasa.gov/research/news/20031222/
HYPOTHETICAL SCENARIOS
Here we address the potentials that reach beyond our current scientific understanding and ask the questions that need to be answered based on current understanding and indicators
Questions
- Is climate sensitivity too low in the climate models? Some measurements are exceeding the models.
- Model sensitivity may not be accounting for the positive feedbacks properly (see UCAR and NASA)?
Problems
- Some of the science used to project 5 meters SLR by 2100 are based on Meltwater Pulse 1a (see e.g. paper by Weaver et al., 2007). via Eric Steig on RealClimate: “This is the same event that gives Hansen his example of super-fast sea level rise. It occurred when Canada and most of Europe were covered by ice sheets, and when the Antarctic ice sheet extended to the edge of the shelf. If Antarctica tried to dump that much ice out now, all the icebergs would ground on the continental shelf. It, like Greenland, is in a far more stable configuration now than it was then. The conditions that produced Meltwater Pulse 1a ares simply not a good analogy for the present.”
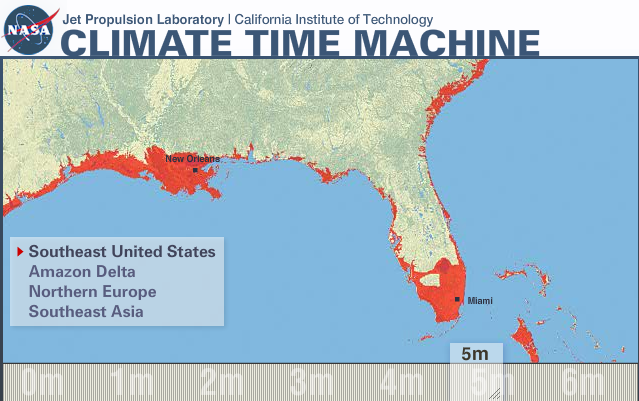
The Case For 5 Meters
HYPOTHETICAL (Non-Scientific Analysis) – Confidence = Possible/Unknown
Dr. James Hansen: “Sea level is already rising at a moderate rate. In the past decade, it increased by 3 centimetres, about double the average rate during the preceding century. The rate of sea level rise over the 20th century was itself probably greater than the rate in the prior millennium, and this is due at least in part to human activity. About half of the increase is accounted for by thermal expansion of ocean water as a result of global warming. Melting mountain glaciers worldwide are responsible for several centimeters of the increase.”
Dr. James Hansen: “Greenland and Antarctica are also contributing to the rise in recent years. Gravity measurements by the GRACE satellites have recently shown that the ice sheets of Greenland and West Antarctica are each losing about 150 cubic kilometres of ice per year. Spread over the oceans, this is close to 1 millimetre a year, or 10 centimeters per century.”
Runaway collapse
Dr. James Hansen: “The current rate of sea level change is not without consequences. However, the primary issue is whether global warming will reach a level such that ice sheets begin to disintegrate in a rapid, non-linear fashion on West Antarctica, Greenland or both. Once well under way, such a collapse might be impossible to stop, because there are multiple positive feedbacks. In that event, a sea level rise of several meters at least would be expected.”
Note: Sea Level Rise is expected to continue increasing beyond 2100. The year 2100 is merely being used as a benchmark for illustrating potential in a given time span.
Alternative Theory for Negative Forcing
Another theory is that additional warming will increase upper atmosphere cloud cover which may increase negative feedbacks enough to counter the warming caused by industrial GHG’s.
It works like this: Water is a greenhouse gas, warming the world increases water evaporation, which further warms the planet. It simultaneously increases cloud cover by virtue of the increased moisture in the atmosphere. This should counter some or all of the climate forcing imposed by the additional greenhouse gases.
In general these models assume some degree of linearity as regards the acceleration combined with non linear feedback mechanisms weighted to the negative. Based on the forcing evidence there is strong reason to believe that the acceleration will be non linear and weighted to the positive.
The last model described is the most negative weighted in consideration of its assumptions.
The paleo record indicates that increased strong climate forcing yields increased temperatures such as in the Triassic and Eocene periods.
Therefore it is reasonable to at least assume the possibility that negative feedbacks will not override the positive forcing levels imposed on the system.
This means that it is more likely that increased moisture will increase tropospheric clouds, and not as many stratospheric clouds as some are projecting (ref. Dr. Richard Lindzen). This lends credence to the idea that H2O is a positive feedback with some negative feedback potential but not sufficient to override the positive forcing, thus resulting in an enhanced greenhouse effect in combination with observed feedbacks.
This also seems probable since we have already observed upper atmospheric (stratosphere) cooling while lower atmosphere (troposphere) is warming.
In summary, the paleo record indicates earth has been much warmer in the past. Therefore one can reasonably assume that positive forcing outweighs negative forcing and stratospheric clouds will not produce sufficient negative forcing.
Sea Surface and Global Mean Temperatures
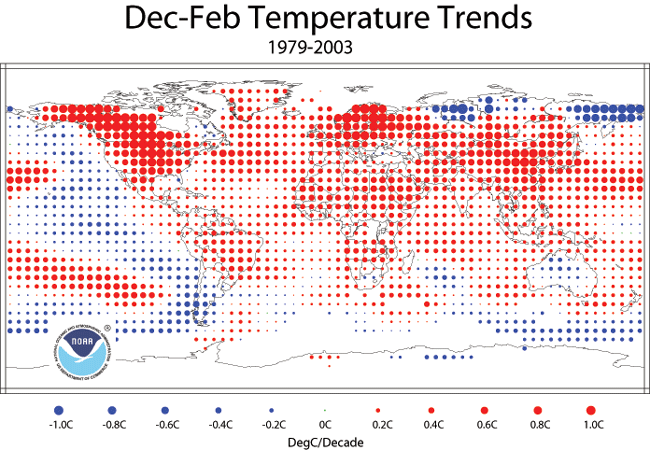
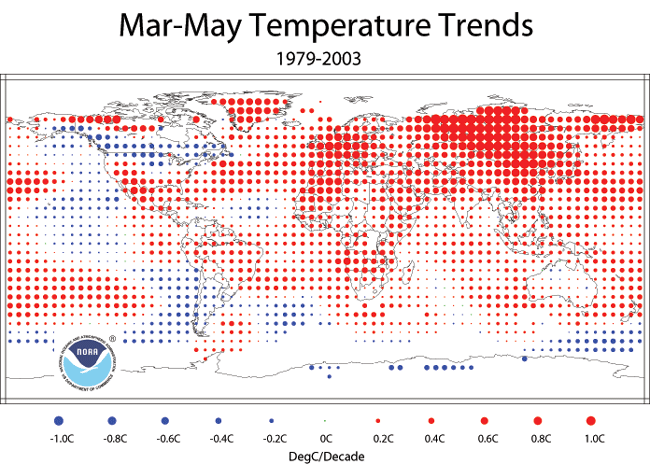
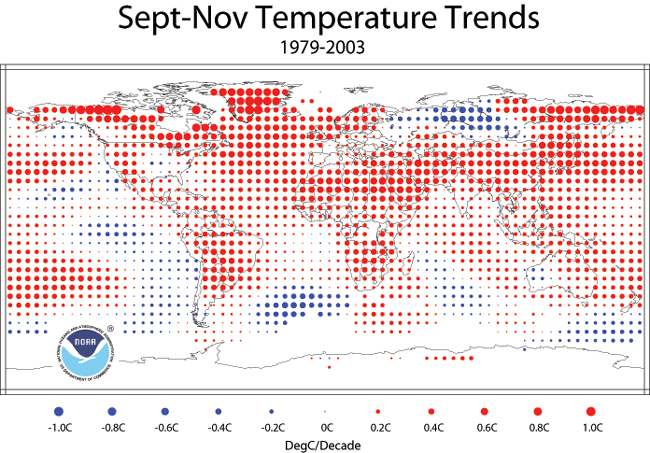
Trends in ocean and land surface temperatures are important for multiple reasons. It relates to thermal expansion as well as tropical cyclone activity. This includes hurricanes and typhoons.
Sea Surface temperature and thermal depth of the temperature regulates storm strength through energy contribution capacity.
The size of a body of water limits its rate of change to a degree. For example The Pacific ocean is larger and therefore has a slower rate of change.
The Atlantic is smaller and can change temperature faster. The gulf of Mexico is very small, as oceanic bodies go, and can have a larger temperature variance range than the Atlantic. The ocean temperatures in the guld regularly breach the 28.5 C barrier thus providing the fuel for storm potential.
The Pacific ocean western United States is still relatively cool compared to other ocean temperatures, due to stronger thermal inertia caused by mass of the body of water. There has been a developing pattern of increase in recent years as the global temps increase.
In the Pacific, west coast America’s: As the temperature variance begins to breach on a more regular basis the 28.5 C barrier and thermal depth increases, we can expect increased storm strength in storms forming off the western coast of the US, similar to the observations in Gulf and east coast regions.
Summary
While extremely difficult to accurately predict time scales and levels of sea level rise, certain assumptions are reasonably clear.
- The sea level Is rising
- Global warming is expected to accelerate in a non linear fashion.
- The climate trends are all leaning toward the upper end of the IPCC estimates.
- Estimating Sea Level Rise over time is extremely difficult.
- The confidence is high that sea level is rising and its rate of increase will increase.
Winter
Spring
Summer
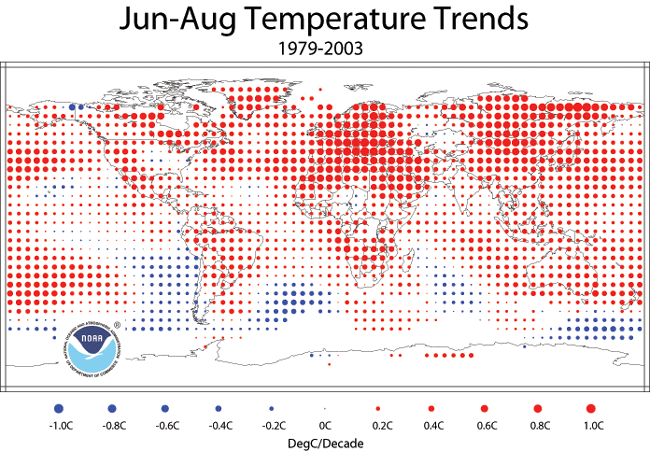
As the Pacific ocean temperature begin to escalate, the potential for increased storm energy rises. Increased sea level rise will slowly increase coastal erosion. Increased storm intensity will translate to rapid coastal erosion based on event intensity and increased wave height.
Fall
UPDATE: September 2007 – 2.5 feet to 2 meters by 2100 v. 5 meters by 2100
Update to SLR Projections:
Between January, 2007 and September 2008 the scientific estimation range of SLR (for 2100) rose from between .5–1.4 meters to .8–2 meters.
The hypothesis of this report series remains that continued understanding of the dynamic processes will yield empirical knowledge of higher SLR over time. Thus indicating that our projected estimations of confidence in higher SLR will become further confirmed as the non linear processes are further understood. Thus it remains reasonable to assume the scientific SLR estimations will rise as evidenced and as expected in concert with natural and imposed negative forcing.
The scientists quoted in this report will not scientifically estimate higher than the science allows and the upper range of that estimation is currently 2 meters SLR by 2100. Large uncertainties, at this time, reduce capacity to scientifically estimate beyond that range. However, some indicate the hypothesis is feasible.
In a recent post about sea level rise, we highlighted a paper by the University of Colorado’s Tad Pfeffer and others in which they show that one can rule out more than 2 meters of sea level rise in the next century. While we liked the paper very much, we also complained that Pfeffer and colleagues had created a bit of a straw man, by implying that it had been seriously proposed that Greenland’s near term contribution to sea level rise could be much larger than that. In fact (we said), none of us in the climate science community ever took such ideas seriously, even if the popular press thought we did. Tad responds by pointing out that in fact there is published work attributing considerable likelihood to such extreme scenarios, and that there are numerous studies that at the very least strong imply it. He also reminded me that their paper actually rules out a contribution of more than about 50 cm from Greenland, significantly below some other recent published estimates. That makes their work even more important, since there are several publications that definitely consider upwards of one meter (from Greenland alone) by 2100 to be plausible. Pfeffer et al. conclude that that is simply not the case (at least in their informed view). Still, we remind readers that our chief complaint was that Pfeffer et al.’s work was taken by many in the media as a downward revision to sea level rise estimates, whereas in fact most informed estimates had put an upper limit well below that. See our earlier post on the IPCC Sea Level numbers.
In any case. Pfeffer et al’.s response to our post follows below. Fair enough.
A response to RealClimate’s post on our paper about sea level rise
W.T. Pfeffer, J.T. Harper, and S. O’Neel
15 September 2008
We have read with interest – and, we admit, surprise – the RealClimate post concerning our 5 September publication in Science entitled “Kinematic Constraints on 21st Century Sea Level Rise.” The source of our surprise, however, is probably not what the RealClimate authors imagine – we had fully expected a vigorous defense of very high rates of sea level rise (greater than 2 m/century), but not a denial that such rates had ever been hypothesized.
We do not state anywhere in our paper that 2m or more of SLR by 2100 has been published as a peer reviewed and “informed estimate”. We do state that this has been ‘inferred’ and ‘argued’ as a “viable 21st century scenario”. We believe there is value in constraining the upper limits to the role of ice dynamics in future SLR. And, from what we know about historical rates of SLR in conjunction with what ‘we know we don’t know’ about ice dynamics, we believe it is reasonable to ponder very high rates of SLR in the next century. However, we also believe that it is problematic to project such a ‘hypothesis’ as a supported theory without proper testing by the scientific method. The question raised by RC is whether or not this hypothesis has circulated within the scientific community.
In his 2007 paper (Environ. Res. Lett. 2(2007)) Hansen proposes a rate of sea level rise of “5 m this century.” This is hypothetical, but he is confident that it is a “far better estimate than a linear response”. This is accompanied by his statement that he finds it “almost inconceivable that BAU climate change would not yield a sea level change of the order of meters on the century timescale.” The provisional nature of his discussion is irrelevant; it is an explicit statement that 5 m of sea level rise in this century is a possibility he regards as viable, published in the scientific literature by the person who is arguably (and deservedly) the most visible and authoritative climate scientist in the world. No reader of this paper would assume that Hansen didn’t actually mean what he said. Hansen reinforced this idea in other publications and statements, including in his briefing to Congress on 23 June 2008 (“sea level rise of at least two meters is likely this century”). Our analysis specifically tested the likelihood of next-century sea level rise of more than 2 m, and Hansen explicitly hypothesized 5 m of sea level rise in this century.
Hansen has gone on record with specific numbers, but other published studies including the 2006 Overpeck and Otto-Bliesner Science papers left the upper limit open ended, and certainly implied it could be quite high. The fact that this idea was present in the scientific community was confirmed for us by 8 scientific presentations we gave on this topic in the past year (5 in the US, including the Fall 2007 AGU and 3 in Europe). At none of those talks did anyone in the audience question what high forecasts we were referring to. The comments we got back on our work were overwhelmingly positive, and were along the lines that what we had presented was a good next step – both to move past the IPCC’s low sea level forecasts, and as a response to the persistent hypotheses of very high rates of sea level rise that were circulating. Criticisms, where they were voiced, were largely that we were underestimating the power of dynamics and that rates of sea level rise well in excess of 2 m/century might occur in spite of our conclusions.
We agree that the media coverage of our paper (as well as others before it) has undesirable side effects. Wherever we had the opportunity we pressed media writers not to use terms like “exaggerated” or “high sea level forecasts debunked,” and we have consistently stressed that our results indicate a very significant sea level rise and are no justification for any kind of complacency. We have stressed that even our low end scenario of 0.8 m of SLR would have tremendous consequences. However, we stand by our statements that sea level rise at rates of substantially more than 2 m this century were in fact put forward as a likely possibility.
Earlier this summer Andy Revkin published a piece in the New York Times about what he has termed the “Whiplash Effect”: confusion created in the public mind by media coverage of rapidly evolving scientific ideas. There has certainly been some whiplash in this case. However it is others who cracked the whip. We have simply refused to let go of the other end.
Response from Gavin Schmidt NASA/GISS
Tad et al, thanks for commenting. There are a number of issues here, and so I think it’s best to start off with what we can probably all agree on. First, the more informed estimates of sea level rise become, the better off we will be, and so your assessment of some of the kinematic constraints is certainly a welcome addition to the literature. Second, as you clearly state, these numbers are significantly in excess of the ‘headline’ numbers that came out of the IPCC report. As you are also aware, IPCC punted on what the worst case scenario could be given non-linear dynamic ice feedbacks. Thus, it is clear to me that your constraints are a significant up-grading of possibilities in the future (and hence our surprise at the thrust of your press release and some of the coverage).
However, scientists, like nature, abhor a vacuum. In the absence of any trustworthy glaciological constraints on the rates of future SLR, it is only natural that scientists will turn to the paleo-record and to heuristic attempts to get an idea of what is possible. It is clear that the paleo-record shows greater than meter/century rises during the deglaciation (MWP 1A), or even in the Holocene (Carlson et al, 2008). Therefore these possibilities cannot be neglected a priori. It is also clear that conditions during the last interglacial (LIG, 125 kya BP) that temperature changes were close to what is anticipated by the end of the century. At that time, equilibrium sea level rise was between 4 and 6 meters higher than at present (with maybe 2 or 3 meters coming from Greenland). Thus for climate conditions that are not too far away from the situation now, multi-meter sea level rise is certainly an eventual possibility (the rates of change at the LIG having not been constrained). And indeed, a simple heuristic calculation such as done by Hansen in the ERL paper easily gives numbers in the range of meters.
These pieces of evidence show that discussion and further investigation of the possibilities of multi-meter sea level rise should be continued and cannot be ruled out a priori. However, stating that something is conceivable is not the same as making a prediction. The Overpeck and Otto-Bliesner papers made no prediction (or even projection) for SLR by 2100, and your implication that they were somehow negligent in not doing so is a little strange. Their study of equilibrium change cannot provide such a constraint and so you seem to be taking them to task for simply not assuming that SLR can be rapid. I would point out as well that their study’s conclusions that maybe 2 to 3 meters of sea level rise at LIG equilibrium came from Greenland (maybe even a little less taking the Wilerslev et al results into account) rather undermine the claim in your paper that people (unnamed) have predicted 2 and 5 meter rises from Greenland alone in the next century. I can find no evidence of this anywhere in the literature. I note you confuse global and Greenland-alone in your text above.
Your main criticism seems to be reserved for Jim Hansen. Despite the fact he is my boss, he is certainly not immune from criticism on that score. However, you are, I think, wrong in this case and have misread him. The ERL paper that you provide as the only example of a specific 5m/century prediction, is curiously enough a discussion about how difficult it is for some in the glaciological community to publicly express their concerns about the state of the ice sheets and the implications (something I have also noticed). The ‘prediction’ you refer to is a simple doubling calculation to demonstrate that non-linear responses could produce multi-meter/century SLR in theory. And since we know that has happened in the past, that can’t actually be wrong. It was a calculation that had no information from the ice sheets, or the climate forcing or anything, therefore I think I am quite right in not describing it as an “informed estimate”. Jim has made his actually worst case scenarios abundantly clear in many interviews, in the Washington Post for instance: “sea level rise that can be measured by feet more than inches”, and in the ERL papers itself “measured in meters”, and in the quote you picked up on. It is not picking nits to point out that all of these statements are basically consistent with the 2m upper bound you came up with.
Eric has made the point that perhaps you were reacting not to actually predictions, but to perceptions among the public, maybe engendered by misleading headlines. That there have been misleading headlines is clear, but I cannot find any related to Hansen’s ERL paper. Media misconceptions should of course be countered and true explanations given, but I see no evidence that the media on the whole has got this story wrong. If anything, the bulk of the coverage (which followed the IPCC report) was way too conservative, and commentators like Bjorn Lomborg get much more press with claims that sea level rise will be less than 10 inches by 2100, than anyone with claims that it will be 20 ft.
To conclude, my main emotion here is disappointment. The issue of sea level rise, and the impact that may have in future seem to me to be one the key implications of climate change for which there are no winners and for which the costs may be enormous. It therefore deserves to be discussed and investigated much more widely than it has been (and as I said, your paper is a useful addition, though I doubt it will be the last word). That educational process is surely larger and more important than criticizing a single paragraph in a relatively obscure publication that got no media attention. Had your press release been more accurately titled as “Global Sea-Rise Levels By 2100 May Be Lower Than One Person Hypothesised But Much Larger Than What Was Reported Following The Publication Of The IPCC Report And If This Happens It Will Be Really Bad News” you would have done the community a much better service.
Additional Materials
El Nino Related Coastal Erosion
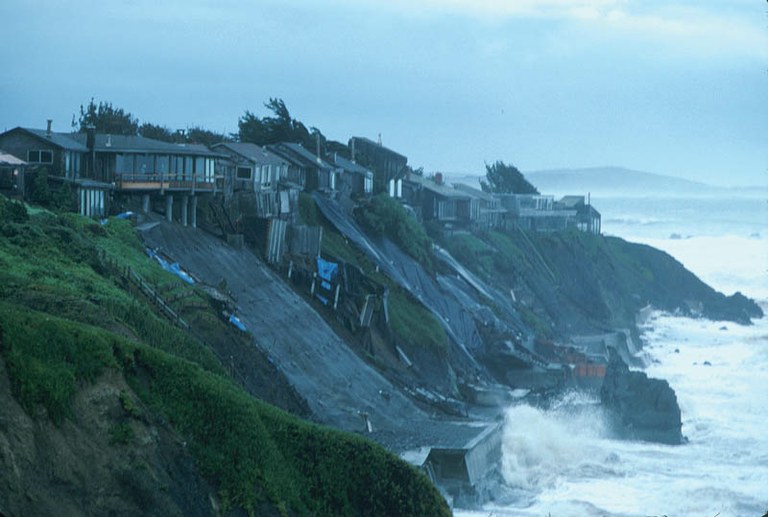
“Heavy rains and high surf from storms associated with the 1998 El Nino event produced severe erosion along the California coast, leading to major property losses.” Source: Paul Neiman, Environmental Technology Laboratory, NOAA
Primarily, SLR is not the main concern for those living in coastal regions, as it provides only slow coastal erosion. The main concern for those living on the beach is increased storm strength and event related erosion. East coast and Atlantic region storm strength is notably higher in recent decades and similar trends are noted on the west coast or Mexico and Southern California, where ENSO (El Nino Southern Oscillation) and PDO (Pacific Decadal Oscillation) are riding on top of the general uptrend in oceanic temperatures.
https://www.climatescience.gov/Library/stratplan2003/final/ccspstratplan2003-chap4.htm
Pacific Decadal Oscillation:
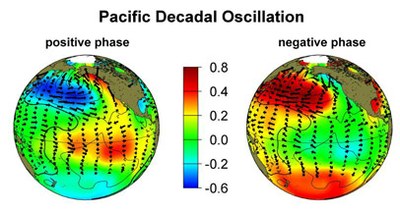
JPL: The Pacific Decadal Oscillation (PDO) is a long-term ocean fluctuation of the Pacific Ocean. The PDO waxes and wanes approximately every 20 to 30 years. From TOPEX/Poseidon data (see below) together with other oceans and atmospheres data, scientists think we have just entered the ‘cool’ phase. The ‘cool’ phase is characterized by a cool wedge of lower than normal sea-surface heights/ocean temperatures in the eastern equatorial Pacific and a warm horseshoe pattern of higher than normal sea-surface heights connecting the north, west and southern Pacific. In the ‘warm’ or ‘positive’ phase, which appears to have lasted from 1977- 1999, the west Pacific Ocean becomes cool and the wedge in the east warms.
https://topex-www.jpl.nasa.gov/science/pdo.html
The PDO current phase may also mitigate the amplification of the ENSO pattern by keeping the ocean temp in the eastern pacific .4 to .8 C cooler. There is still a possibility of A stronger ENSO canceling the PDO affect to a degree. It should be noted that the PDO during the last major El Nino Event 1998 was at the end of the positive phase for the eastern pacific, meaning it was entering negative/cool phase for that region of the pacific.
Translated, that indicates that very strong El Nino events are still possible even in the cool phase of the PDO.
About scientists whose material is included in this report:
Stefan Ramstorf
A physicist and oceanographer by training, Stefan Rahmstorf has moved from early work in general relativity theory to working on climate issues. He has done research at the New Zealand Oceanographic Institute, at the Institute of Marine Science in Kiel and since 1996 at the Potsdam Institute for Climate Impact Research in Germany (in Potsdam near Berlin). His work focuses on the role of ocean currents in climate change, past and present. In 1999 Rahmstorf was awarded the $ 1 million Centennial Fellowship Award of the US-based James S. McDonnell foundation. Since 2000 he teaches physics of the oceans as a professor at Potsdam University. Rahmstorf is a member of the Advisory Council on Global Change of the German government and of the Academia Europaea. He is a lead author of the paleoclimate chapter of the 4th assessment report of the IPCC.
James E. Hansen
James E. Hansen (born March 29, 1941 in Denison, Iowa) heads the NASA Goddard Institute for Space Studies in New York City, a part of the Goddard Space Flight Center in Greenbelt, Maryland, Earth Sciences Division. He is currently an adjunct professor in the Department of Earth and Environmental Sciences at Columbia University, and also serves as Al Gore’s science adviser. Hansen is best known for his research in the field of climatology and his testimony on climate change to congressional committees in the 1980s that helped raise broad awareness of the global warming issue. He is also noted for publishing “an alternative scenario” for global warming which states that in the past few decades the warming effect produced by increased CO2 has been largely offset by the cooling effect of aerosols also produced in burning fossil fuels, and that most of the net warming so far is due to trace greenhouse gases other than CO2. He has been a critic of both the Clinton and current Bush Administration’s stances on climate change.
Gavin A. Schmidt
Gavin Schmidt is a climate modeler at the NASA Goddard Institute for Space Studies in New York and is interested in modeling past, present and future climate. He works on developing and improving coupled climate models and, in particular, is interested in how their results can be compared to paleoclimatic proxy data. He also works on assessing the climate response to multiple forcings, such as solar irradiance, atmospheric chemistry, aerosols, and greenhouse gases. He received a BA (Hons) in Mathematics from Oxford University, a PhD in Applied Mathematics from University College London and was a NOAA Postdoctoral Fellow in Climate and Global Change Research. He serves on the CLIVAR/PAGES Intersection and the Earth System Modeling Framework Advisory Panels and is an Associate Editor for the Journal of Climate. He was cited by Scientific American as one of the 50 Research Leaders of 2004, and has worked on Education and Outreach with the American Museum of Natural History, the College de France and the New York Academy of Sciences. He has over 50 peer-reviewed publications.
Jeff P. Severinghaus
Jeff Severinghaus, Professor of Geosciences, Scripps Institution of Oceanography, University of California, San Diego, July 2004-present; Ph.D., Columbia University, Lamont-Doherty Earth Observatory, July 1995 Geological Sciences, emphasis Stable Isotope Geochemistry; M.A., University of California, Santa Barbara, June 1988; Geology, emphasis Tectonics; Geology Summer Field Course, Indiana University, 1983; B.A. Oberlin College, 1983. Geology. Awards: Comer Science and Education Fellowship; David and Lucile Packard Fellowship; Distinguished Lecturer, Scripps Institution of Oceanography, 1999; NOAA Climate and Global Change Postdoctoral Fellowship, 1995-1997; US Dept. of Energy Global Change Graduate Fellowship, 1992-1995; University of California Regents Fellowship, 1985-87; NSF Graduate Fellowship Competition, (Honorable Mention); National Association of Geology Teachers/USGS Summer Field Camp Award; Research Interests: Reconstructing changes in atmospheric noble gas composition over the past million years from air trapped in glacial ice; Radiocarbon of methane in late glacial-age ice as a test of the sedimentary methane clathrate degassing hypothesis; Isotopic fractionation of air in polar firn (snow) due to gravitational settling and thermal diffusion, with implications for gas age-ice age differences and leads and lags of climate versus greenhouse gases in ice core records; Pleistocene global carbon cycle variations deduced from oxygen and noble gas measurements in ice cores; Mechanisms of millennial-scale climate oscillations and climate bifurcations; Quantification of abrupt temperature changes using measurements of nitrogen and argon isotopes in ice cores.
Tad Pfeffer
Professor, University of Colorado – Specialty: Glaciology, continuum mechanics, heat transfer. Research Interests: My research interests are broadly focused on modern glacier physics, including ice mechanics and glacier dynamics, heat and mass transfer in snow and ice, atmosphere/glacier and ocean/glacier interactions. My approaches to these problems include field work in Alaska, Greenland, and the Canadian Arctic, experimental laboratory work, and mathematical and numerical modeling. Applications of this work include estimates of future sea-level change, analysis and modeling of iceberg calving dynamics of tidewater glaciers and ice streams, determination of the internal velocity field in ice, and reconstruction of Late Wisconsin advances of ice in the Hudson Strait region. Outstanding Award: 1997 American Geophysical Union Editor’s Citation for Excellence in Refereeing for JGR-Solid Earth.
Rasmus Benestad
Rasmus Benestad, a physicist by training and affiliated with the Norwegian Meteorological Institute (met.no) and the Oslo Climate Group (OCG). D.Phil in physics from Atmospheric, Oceanic & Planetary Physics at Oxford University in the United Kingdom. Recent work involve a good deal of statistics (empirical-statistical downscaling, trend analysis, model validation, extremes and record values). Has some experience with electronics, cloud micro-physics, ocean dynamics/air-sea processes and seasonal forecasting. In addition, Wrote the book ‘Solar Activity and Earth’s Climate’ (2002), published by Praxis-Springer, and was a member of the council of the European Meteorological Society for the period (2004-2006), representing the Nordic countries and the Norwegian Meteorology Society.
Eric Steig
Eric Steig is an isotope geochemist at the University of Washington in Seattle. His primary research interest is use of ice core records to document climate variability in the past. He also works on the geological history of ice sheets, on ice sheet dynamics, on statistical climate analysis, and on atmospheric chemistry. He received a BA from Hampshire College at Amherst, MA, and M.S. and PhDs in Geological Sciences at the University of Washington, and was a DOE Global Change Graduate fellow. He was on the research faculty at the University of Colorado and taught at the University of Pennsylvania prior to returning to the University of Washington 2001. He has served on the national steering committees for the Ice Core Working Group, the Paleoenvironmental Arctic Sciences initiative, and the West Antarctic Ice Sheet Initiative, all sponsored by the US National Science Foundation. He was a senior editor of the journal Quaternary Research, and is currently director of the Quaternary Research Center. He has published more than 60 peer-reviewed articles in international journals.
Report prepared by:
John P. Reisman
John P. Reisman worked at the University of the World with Dr. James Grier Miller, Author of Living Systems Theory and Dr. Martin Chamberlain (Chancellor Emeritus, UCSD), researching educational systems. While there he wrote a simplified systems theory for understanding general systems operation and dynamics, and developed a methodology to help understand the health of a given system. He worked, with the assistance of Dr. Jonas Salk, developing The Learning Center/PATH Project, which was presented to the US Department of Education and EDUCOM and developed the TLC/PATH project for the Reagan administrations, ‘School 2000’ project. More recently he has conducted research and development efforts in energy efficient urban and industrial structures and was awarded a patent for a time management system he invented. John studied engineering and early in his career worked in the media industry in production. He worked for the Department of Defense while living at the NATO base in Iceland. After 9/11 He worked for the Transportation Security Administration (TSA) and Homeland Security. Most recently he has applied his examinations to climate and energy systems and inter-dynamic relationships.

