This article addresses contexts regarding climate and the weather events that have occurred in July and August, 2010 around the planet.
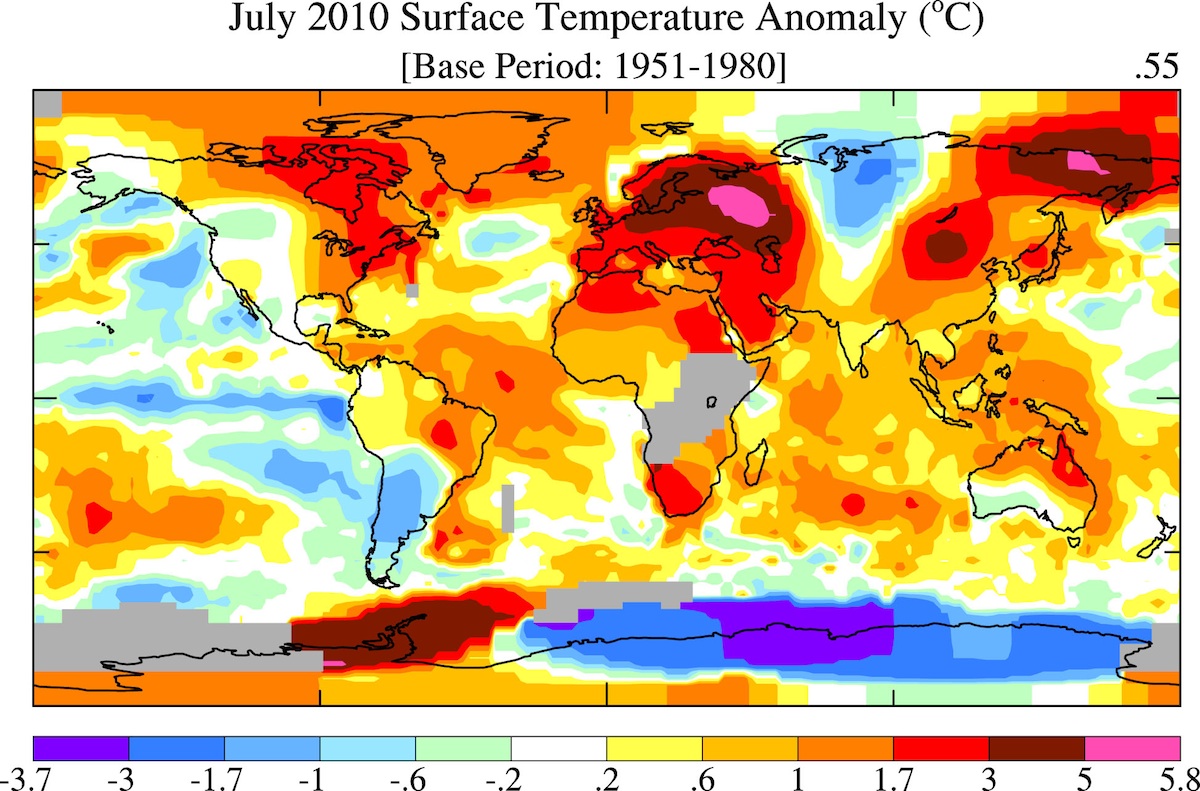
July 2010 Surface Temp Anomaly
Weather is not Climate
First we must note that weather is not climate and no single weather event can be said to be strictly a climate change related event. That said, it is important to note that climate does influence weather and the events of this summer are the type of occurrences that are expected with a warming world.
Natural variation plays an important role in weather though. Changes in solar energy, oceanic cycles, radiative forcing effects, all work together in a complex dynamic planet-wide system that generates weather. This all occurs within what might be called ‘Climate Potential’. Climate Potential would be a description of the global climate potentials based on the the existing forcing, and the weather event potentials one could achieve from that forcing, including natural variation.
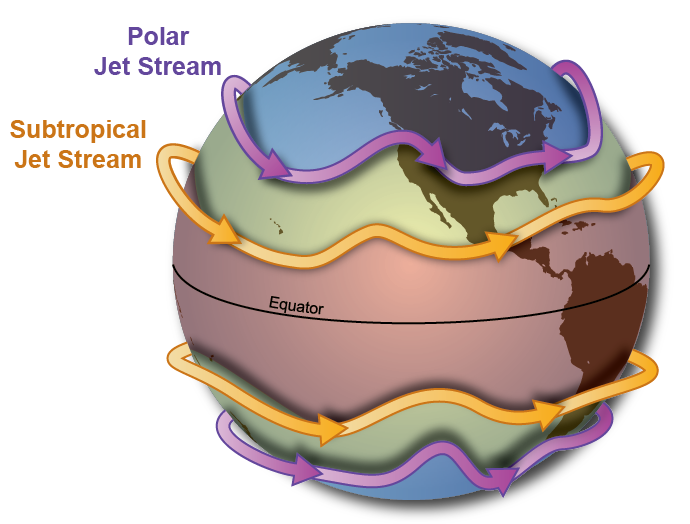
There are some indications that recent events can be caused by low solar activity that causes blocking mechanisms that slow or stop the normal oscillating wave motion of the jet-stream, which flows around the earth west to east. Powerful spinning wind currents called Rossby waves can push the jest-stream north and south.
However, the occurrence of two similar extreme heat events (2003 and 2010) occurring with 10 years of each other, combined with the new climate path due to human induced increases in radiative forcing, does lend to the potential that these events are not only what has been predicted with global warming, but that the strength of these events may be influenced by the new climate path.
Probably the simplest explanation of Rossby waves is that the are influenced by changing forces in the Coriolis effect with latitude. Since higher latitudes are shorter in east-west distance than lower latitudes. This affects the Coriolis force and thereby effects the Rossby waves. Rossby waves are subset inertial waves caused by these changes in force. That said, there are many additional factors to consider.
The jet-streams movement normally shifts east and weather systems follow the movement.
Conditions can cause what are called blocking events that can counter the normal fluctuation of the jet-stream. Strong Rossby waves can push westward against the eastward flow of the jet-steam. The wave pressure and the jet-stream can then counter balance each other and cause a stationary blocking event for an extended period of time. When this occurs, the weather patterns on either side of the wave can actually hold in place.
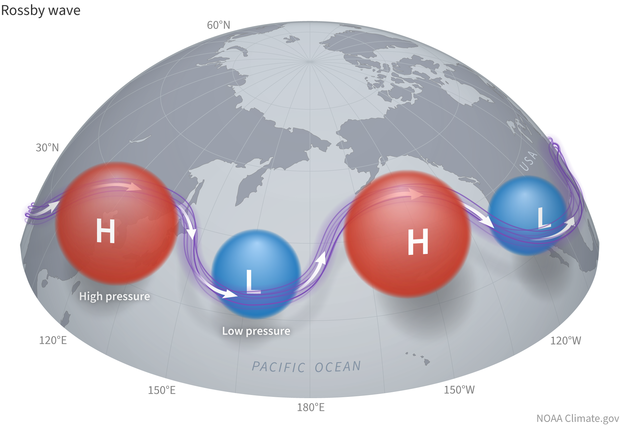
Warm air can gather in the peaks, while cold air can gather in the troughs. Weather systems can become locked in place temporarily. For example, a high pressure system might sit in the same place during summer and cause an area to heat up. While a low pressure system can sit and draw in any moisture flowing into it and cause excessive precipitation.
An elongated trough can cause warm air to travel up the wave into the peak area from warmer lower latitudes, while at the same time drawing colder air from the north into a trough caused by the combined action of the standing wave, and the deep troughs and peaks.
While global warming is expected to increase droughts and floods, according to Gerald Meehl (National Center for Atmospheric Research), there is currently not enough resolution in the climate models to determine whether increased greenhouse gases are playing a role in these events, or how much. It has been noted that low solar energy can increase the strength of Rossby waves and we have had low solar activity for several years while transitioning through the bottom of the Schwabe cycle, and, there has been an increase in the strength of Rossby waves in the last few years. Yet to be determined is the strength of the correlation.
While these events may simply be natural variation, climate change may still be playing a role. Further study and increased model resolution may reveal important understanding of these natural events and how they may change in the future as warmer temperatures manifest new weather patterns, or regional climate change in the earth climate system.
Source: New Scientist – Frozen jet stream links Pakistan floods, Russian fires
Source: https://en.wikipedia.org/wiki/Rossby_wavehttps://en.wikipedia.org/wiki/Rossby_wave
What Climate Looks Like… So Far
By Dr. James Hansen August 13, 2010
The July 2010 global map of surface temperature anomalies (main image above), relative to the average July in the 1951-1980 period of climatology, provides a useful picture of current climate. It was more than 5°C (about 10°F) warmer than climatology in the eastern European region including Moscow. There was an area in eastern Asia that was similarly unusually hot.
The eastern part of the United States was unusually warm, although not to the degree of the hot spots in Eurasia. There were also substantial areas cooler than climatology, including a region in central Asia and the southern part of South America. The emerging La Nina is now moderately strong, as evidenced by the region cooler than climatology along the equator in the eastern and central Pacific Ocean.
What we can say is that global warming has an effect on the probability and intensity of extreme events. This is true for precipitation as well as temperature, because the amount of water vapor that the air carries is a strong function of temperature. So the frequency of extremely heavy rain and floods increases as global warming increases. But at times and places of drought, global warming can increase the extremity of temperature and associated events such as forest fires.
Source: https://www.columbia.edu/~jeh1/
Source: https://data.giss.nasa.gov/gistemp/2010july/
Source: Download PDF – What Global Warming Looks Like
What Happened in Western Russia?
By NOAA/ESRL (Earth System Research Laboratory) August 13, 2010
The sector exhibits high climatological frequency of blocking during July, with an average of 15% of summer days experiencing a blocking conditions. During the first 42 days of the summer of 2010 (thru 11 August) this region has experienced 60% blocking days. This event is the most prolonged blocking event over Western Russia for the period since 1948. The duration of this blocking event has been particularly long, and the intensity of the high pressure anomaly itself has been unusually strong. The intensity of the positive 500mb height anomalies averaged over the geographic region of eastern Europe and western Russia during July 2010 exceeds any prior occurrence of anticyclonic blocking. Preliminary estimates indicate that the strength of the height anomaly at 500mb during July 2010 is equal to nearly 4 times the standard deviation of July heights—a departure amplitude similar to that in the region’s July surface temperatures. Typically, there is little persistence of the circulation pattern from July to August, although the current block that formed in early July has continued with great strength through the second week of August.
The extreme surface warmth over western Russia during July and early August is mostly a product of the strong and persistent blocking high. Surface temperatures have soared as a result of the combination of clear skies, sinking motion within the environment of the high pressure causing compressional heating of air, the lack of any temporary relief owing to the blocking of the typical cold fronts that cool the region intermittently in summer. Add to this scenario the cumulative effect of drought that began in early summer which has caused soils to dry and plants to desiccate to wilting point , thereby causing additional surface warming via land feedbacks as the blocking condition persisted. These are all well-known and studied physical processes that have accompanied summertime blocking and heat waves in the past.
Source: https://www.esrl.noaa.gov/psd/csi/moscow2010/
July Temperature Anomalies
By NCDC (National Climate Data Center)
Global Highlights
- The combined global land and ocean average surface temperature for July 2010 was the second warmest on record, behind 1998, at 16.5°C (61.6F), which is 0.66°C (1.19°F) above the 20th century average of 15.8°C (60.4°F).
- The July worldwide land surface temperature was 1.03°C (1.85°F) above the 20th century average of 14.3°C (57.8°F)—the warmest July on record.
- The worldwide ocean surface temperature was 0.54°C (0.97°F) above the 20th century average of 16.4°C (61.5°F) and the fifth warmest July on record. The warmth was most pronounced in the Atlantic Ocean.
- La Niña conditions developed during July 2010, as sea surface temperatures (SST) continued to drop across the central and eastern equatorial Pacific Ocean. According to NOAA’s Climate Prediction Center, La Niña is expected to strengthen and last through the Northern Hemisphere winter 2010-2011.
- For the year-to-date, the global combined land and ocean surface temperature of 14.5°C (58.1°F) was the warmest January-July period on record. This value is 0.68°C (1.22°F) above the 20th century average.
Climate Affects Weather
Unprecedented sequence of extreme weather events.
By WMO (World Meteorological Organization) August 11, 2010
“Several regions of the world are currently coping with severe weather-related events: flash floods and widespread flooding in large parts of Asia and parts of Central Europe while other regions are also affected: by heatwave and drought in Russian Federation, mudslides in China and severe droughts in sub-Saharan Africa. While a longer time range is required to establish whether an individual event is attributable to climate change, the sequence of current events matches IPCC projections of more frequent and more intense extreme weather events due to global warming. The Monsoon activity in Pakistan and other countries in South-East Asia is aggravated by the la Niña phenomenon, now well established in the Pacific Ocean.”
Source: WMO (World Meteorological Organization) – Current extreme weather events
Since we now know that human-induced forcing on the climate system is essentially unequivocal, and that that imposed forcing is now affecting weather systems including natural variation and natural cycle, we also need to recognize that even though single events are not directly attributable to climate change, they are directly related to climate change.
Point of fact: These types of extreme weather events the planet is now experiencing have been expected by the worlds leading climate research units and have been generally predicted. Since climate is measured in trends and averages in is difficult to do direct attribution to a single event. However, the trends are reasonably clear as noted in attribution studies.
Note: While it is expected that these types of event occurrences are expected to increase in number, it is also important to understand that they are expected to increase in severity.
Therefore, it is not unreasonable to look at the weather this year, in the context of the known direction of our human-caused climate forcing and say that this is a taste of our future, on an ongoing and accelerating pace. Natural variation will still happen, but the trends will continue to increase event occurrences of this type and their amplitude.
Now, with that in mind, from the scientific perspective, here is what has been expected with a warming world:
- Rising Air Temperature (near surface)
- Rising Atmospheric Moisture Content
- Rising Ocean Heat Content
- Rising Sea Level
- Rising Sea Surface Temperature
- Rising Temperature Over Oceans
- Rising Temperature Over Land
- Loss of Snow Cover
- Loss of Glaciers
- Loss of Sea Ice
- Latitudinal Shift of the Jet-Stream
- Changes in Soil Moisture Content
- Increases in Drought Events and severity
- Increases in Flood Events and Severity
- Reduced Crop Production Capacity Due to Precipitation and Drought Events
Here is what is observed now:
- Rising Air Temperature (near surface) [YES]
- Rising Atmospheric Moisture Content [YES]
- Rising Ocean Heat Content [YES]
- Rising Sea Level [YES]
- Rising Sea Surface Temperature [YES]
- Rising Temperature Over Oceans [YES]
- Rising Temperature Over Land [YES]
- Loss of Snow Cover [YES]
- Loss of Glaciers [YES]
- Loss of Sea Ice [YES]
- Latitudinal Shift of the Jet-Stream [YES]
- Changes in Soil Moisture Content [YES]
- Increases in Drought Events and severity [YES]
- Increases in Flood Events and Severity [YES]
- Reduced Crop Production Capacity Due to Precipitation and Drought Events [YES]
General Source Reference: Current Climate Conditions
Summary
There are other things predicted such as increases in tropical disease incidence at different latitudes, seasonal shift as pertaining to planting times, fire season shift, monsoonal shift, species extinction rates, etc. Of course all of this will have economic impacts that vary in significance depending on the effect. The evidence is clear and unambiguous. Mankind has and is continuing to influence the climate system of earth.
With all of this in mind, let us consider this in the context of this years ‘weather’ events:
Relevant News and Event Highlights
Russia bans grain exports amid severe drought
Source Associated Press – By LYNN BERRY Associated Press Writer Aug 5, 12:26 PM EDT
MOSCOW (AP) — Russia banned grain exports for the rest of the year on Thursday after a severe drought and wildfires destroyed 20 percent of its wheat crop. The price of wheat, which has already jumped 70 percent on world markets this summer, rallied further on the news.
Ice Island 4 times larger that Manhattan breaks off Greenland

Source CNN – August 13, 2010 5:14 a.m. EDT
Flash floods inundate central Europe
Source Reuters – By Rob Strybel WARSAW | Sun Aug 8, 2010 11:01am EDT
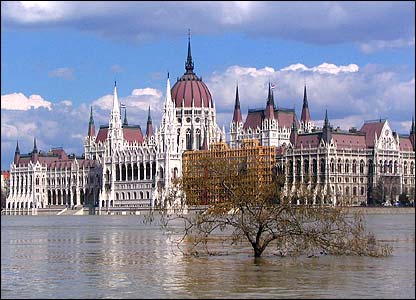
(Reuters) – Rescue workers sought to clear flood-borne debris including damaged cars and evacuate victims after heavy rains and stormy winds across central Europe killed at least 15 people over the weekend. Heavy downpours on Saturday caused rivers to overflow their banks and a dam to burst, submerging Bogatynia and other towns in the southwest corner of Poland and killing at least three people, Polish officials said on Sunday.
Bread price blow raises danger of interest rate rise
The Sunday Herald, Scotland – Kenny Kemp, 8 Aug 2010
Wheat prices have risen 70% in the last five weeks. The risks of near-term interest rate increases are mounting as Scotland’s bakers and supermarkets pass on a hyper-inflationary price increase of up to 15% for bread and flour-related products from this coming week. With wheat prices having risen 70% in the last five weeks, bakers confirmed that the price of a loaf will rise by at least 10p.
Death toll in China landslides rises to 1,117
Source: Associated Press – By DAVID WIVELL Associated Press Writer Aug 11, 9:53 AM EDT
ZHOUQU, China (AP) — Heavy rains Wednesday lashed a remote section of northwestern China as the death toll from weekend flooding that triggered massive landslides jumped to 1,117 and the hopes of finding more survivors faded. At least 627 people were still missing, the state-run Xinhua News Agency reported Wednesday night, citing local officials.
ANALYSIS-Grain price rise may fuel Mideast, Europe unrest
Source Reuters, Africa – By Peter Apps, Political Risk Correspondent Aug 11, 2010 10:27am GMT
LONDON, Aug 11 (Reuters) – Rising grain prices from Russia’s drought and fires will pressure populations already hit by the financial crisis and could stoke unrest — particularly in the Middle East, North Africa and parts of Europe. Wheat prices have risen by nearly 70 percent since June after Russia suffered its worst drought in 130 years and are at their highest since 2008, when the last major food price rally sparked protests and riots in a string of emerging nations. Analysts warn that if prices stay high then the threat of street violence will increase — at least up to a point.
Rescue teams race against Pakistan floods and pirate bandits
Source – By Hashim Shukoor, McClatchy Newspapers / August 11, 2010 Rohri, Pakistan

… worst flooding in Pakistan’s history was cresting Tuesday as it moved south down the Indus River toward the Arabian Sea. The water, which had risen slowly here for a week, gushed up over the weekend as the main body of the torrent swept in from the north, drowning farmlands and jungle as far the eye can see. The flooding has killed some 1,600 people and affected 14 million others, according to the United Nations, overwhelming the government’s ability to cope and submerging some of the most heavily populated areas and fertile agricultural lands. In Sindh alone, some 1.5 million people have been displaced so far, provincial authorities said Tuesday.
UN warns of militant threat in Pakistan floods
Source The Sydney Morning Herald Australia – By HASAN MANSOOR August 11, 2010 – 11:14PM
A senior UN envoy warned Wednesday that militants could exploit Pakistan’s worst humanitarian disaster as the government called on foreign donors to step up efforts to contain the crisis. The United Nations is to launch an international appeal in New York, calling for hundreds of millions of US dollars to provide urgent assistance to six million people it says now depend on aid for survival.
Drought and rains still blight Black Sea wheat crops
Source Reuters – By Aleksandras Budrys MOSCOW | Wed Aug 11, 2010 8:59am EDT
(Reuters) – Drought in Russia, Ukraine and Kazakhstan looked set to continue for at least another week, while heavy rainfall has drenched Romania and Bulgaria.
Heat will hammer Russia for the next 10 days, a top weather official said, and seeding for the winter grain crops is in danger if there is no rain after that. The drought could slash Russia’s 2010 grain output by nearly 40 percent to 60 million tons, and the winter wheat sowing campaign could begin to be in jeopardy if there is no rain during or right after the next 10 days.
Downpours bring more worry for China landslide town
Source Reuters – By Ben Blanchard ZHOUQU | Wed Aug 11, 2010 9:54am EDT
China (Reuters) – The risk of fresh downpours threatened more misery on Wednesday for a Chinese town devastated by a landslide and further threatened by an unstable lake behind a barrier of mud.
What’s behind the weather chaos?
Source CNN – By Brandon Miller, CNN Meteorologist August 12, 2010 12:09 p.m. EDT
(CNN) — Is the record-shattering heatwave that has been blamed for the death of thousands in Russia somehow related to the devastating flooding in Pakistan? Are these disasters happening more frequently — and are they a result of global warming? Sometimes these connections can clearly be observed and understood. At other times they are more complex, taking place across time scales much longer than we are able to observe.
Ukraine seeks to curb grain exports in 2010/11-UPDATE 2
Source Reuters – By Natalia Zinets and Pavel Polityuk August 13, 2010 12:59:11 AM GMT
KIEV, Aug 11 (Reuters) – The Ukrainian government, fearful of a possible food grain shortage at home, said on Wednesday it was considering curbing grain exports, although a final decision would be made next week. The grain harvest in Ukraine, the world’s No 1 exporter of barley and sixth-largest of wheat, is likely to fall 13 percent to 40-42 million tonnes this year from last, after severe winter frosts and a scorching summer heatwave. It needs more than half of that total for itself.
Long, hot summer of fire, floods fits predictions
NEW YORK – Floods, fires, melting ice and feverish heat: From smoke-choked Moscow to water-soaked Iowa and the High Arctic, the planet seems to be having a midsummer breakdown. It’s not just a portent of things to come, scientists say, but a sign of troubling climate change already under way. The weather-related cataclysms of July and August fit patterns predicted by climate scientists, the Geneva-based World Meteorological Organization says — although those scientists always shy from tying individual disasters directly to global warming.

American tourists in Moscow where smoke from fires blanket the city.
Aug. 18 – Huge ice chunk breaks off Ellesmere Island
reported by CBC News Tuesday, August 24, 2010 | 8:09 PM CST
A large parcel of ice has fractured from a massive ice shelf on Ellesmere Island in Nunavut, marking the third known case of Arctic ice loss this summer alone. The chunk of ice, which scientists estimate is roughly the size of Bermuda, broke away from the Ward Hunt Ice Shelf on the island’s northern coast around Aug. 18, according to NASA satellite imagery. At 40 metres thick, the Ward Hunt Ice Shelf is estimated to be 3,000 to 5,000 years old, jutting off the island like an extension of the land. “The cracks are going right to the mainland, basically, right to Ellesmere Island,” John England, a professor of earth and atmospheric sciences with the University of Alberta, told CBC News on Tuesday. “So, in the core of the ice shelf itself, the fracturing is occurring. “I think that’s really quite significant, that it’s like the most resistant and most tenacious part of the ice shelf is now being dismantled.”
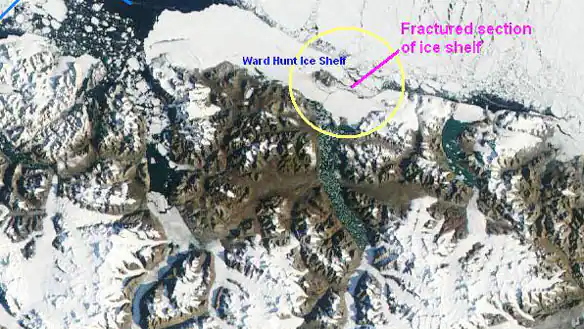
The chunk of ice that broke off from the Ward Hunt Ice Shelf on Aug. 18 is circled in the above image. The ice shelf extends from the northern coast of Ellesmere Island, which is visible in the bottom two-thirds of this satellite image. (NASA/GSFC, MODIS Rapid Response)

