Story: Peak petroleum; Story: Strong negative phase of the Arctic Oscillation (AO); Story:Polar Amplification Effect & Current Polar Conditions; Story: Mass tree deaths in Amazon; Story: GOP pushes to drop climate change research funding; Story: House Energy & Commerce Committee pushes to repeal EPA’s authority to regulate greenhouse gases.
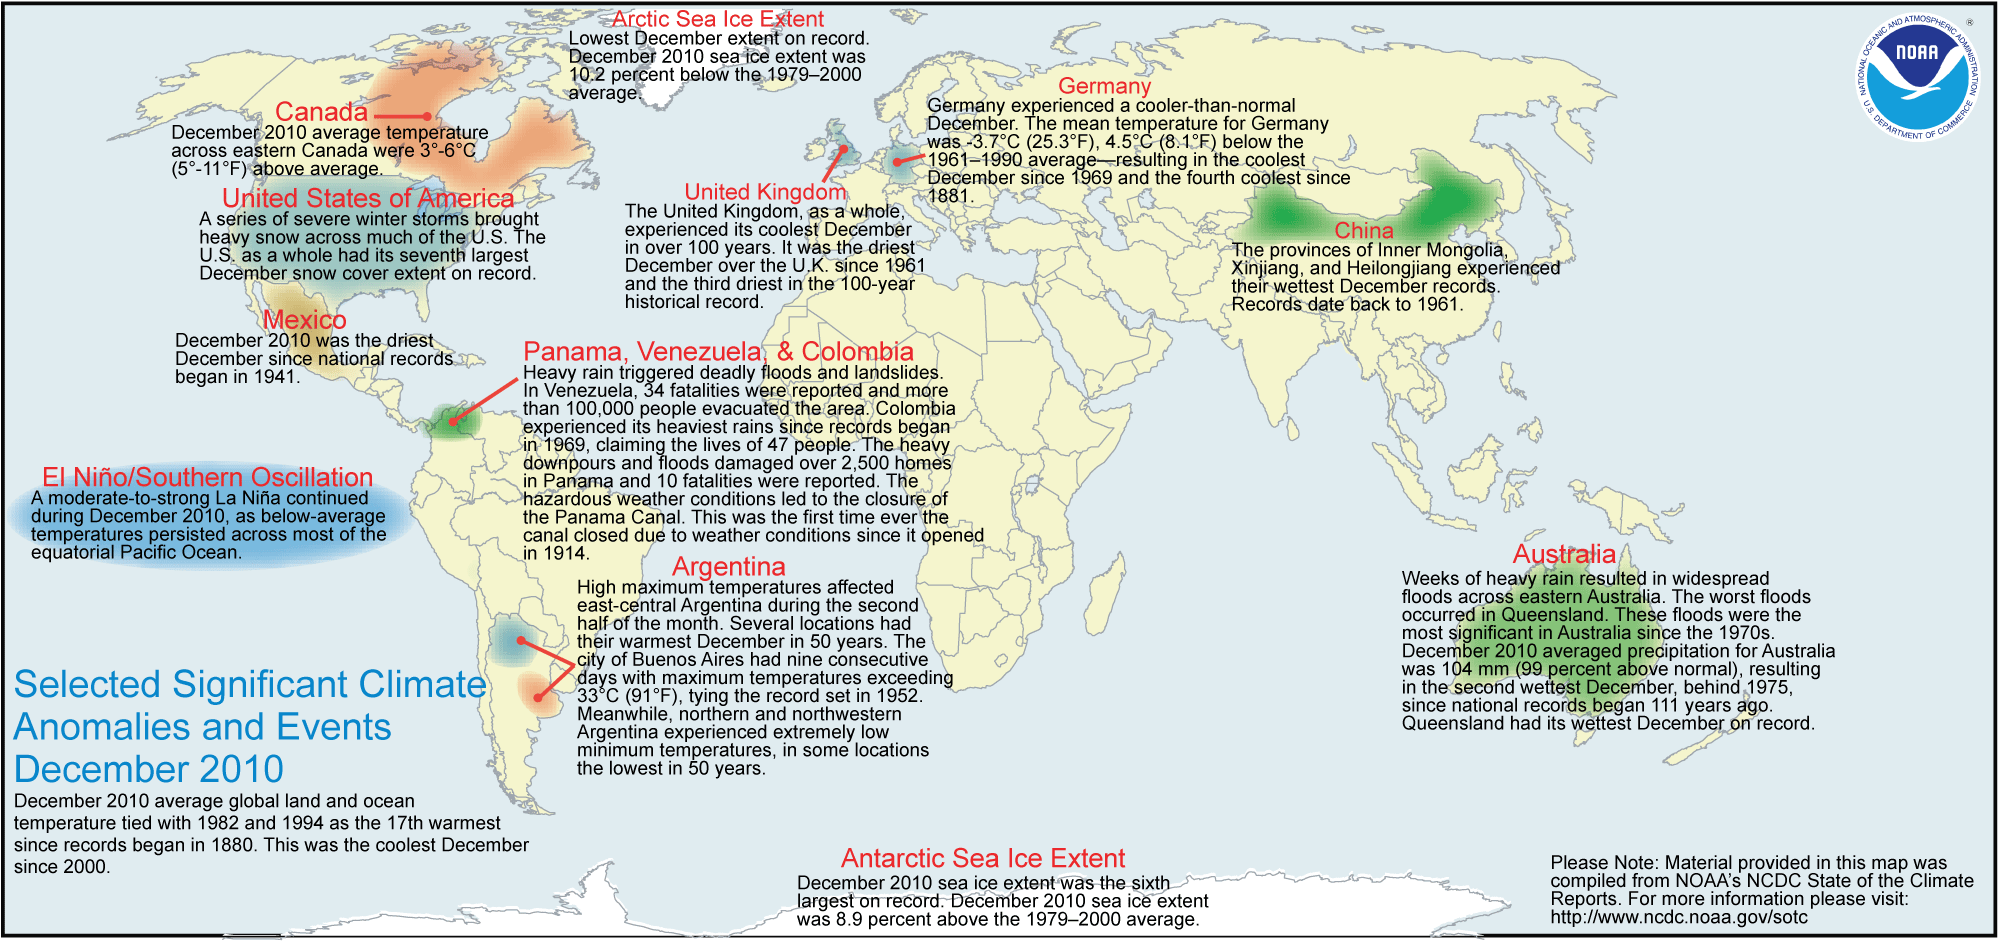
Dec 2010 Climate Anomalies/Events
The Data form December 2010 is now available. This months report illustrates the climate anomalies and the context of climate change and weather vs. climate. along with Arctic Amplification Effect and the Arctic Oscillation.
We also discuss Peak Petroleum as it has relevant contexts with regard to climate change, mitigation and adaptation, and direct economic impact potential. The Sword of Damocles is that hitting peak petroleum before we have made strong moves toward conservation of fossil fuel energy resources increases inflationary pressures that resonate throughout the economy.
If there is one mitigating factor it is the two edges sword of coal/tar sands. As the price of gasoline passes $5 dollars a gallon, tar sands become more affordable monetarily in the short term. Unfortunately tapping this resource increases future costs exponentially with regard to increased radiative forcing which will cause further latitudinal shift of the jet stream, thus further altering the atmospheric hydro-logic cycles, thus impinging on current agricultural infrastructure and likely resulting in increased storm precipitation events.
Peak Petroleum
by John P. Reisman
As pointed out in the February, 2010 Leading Edge report, the world is pressing toward peak petroleum.
These images from Mazama Science illustrate a peak curve and downslope starting two years ago. This can include both supply and demand issues. The economic downturn that began in 2008 is a part of the demand equation. Therefore is is difficult to see if we are at or passing peak petroleum. The analysis presented in the JFCOM report in 2010 may be conservative and actual peak, due to the imprecision of quantitative analysis on supply and demand indicates that peak may be sooner, or possibly later.


Source: https://mazamascience.com/OilExport/index.html
Strong Negative Phase Arctic Oscillation (AO)
by National Snow and Ice Data Center (NSIDC)
Overview of conditions
Figure 1. Arctic sea ice extent for December 2010 was 12.00 million square kilometers (4.63 million square miles). The magenta line shows the 1979 to 2000 median extent for that month. The black cross indicates the geographic North Pole. Sea Ice Index data. About the data.
—Credit: National Snow and Ice Data Center
Arctic sea ice extent averaged over December 2010 was 12.00 million square kilometers (4.63 million square miles). This is the lowest December ice extent recorded in satellite observations from 1979 to 2010, 270,000 square kilometers (104,000 square miles) below the previous record low of 12.27 million square kilometers (4.74 million square miles) set in 2006 and 1.35 million square kilometers (521,000 square miles) below the 1979 to 2000 average.
As in November, ice extent in December 2010 was unusually low in both the Atlantic and Pacific sides of the Arctic, but particularly in Hudson Bay, Hudson Strait (between southern Baffin Island and Labrador), and in Davis Strait (between Baffin Island and Greenland). Normally, these areas are completely frozen over by late November. In the middle of December, ice extent stopped increasing for about a week, an unusual but not unique event.
Conditions in context
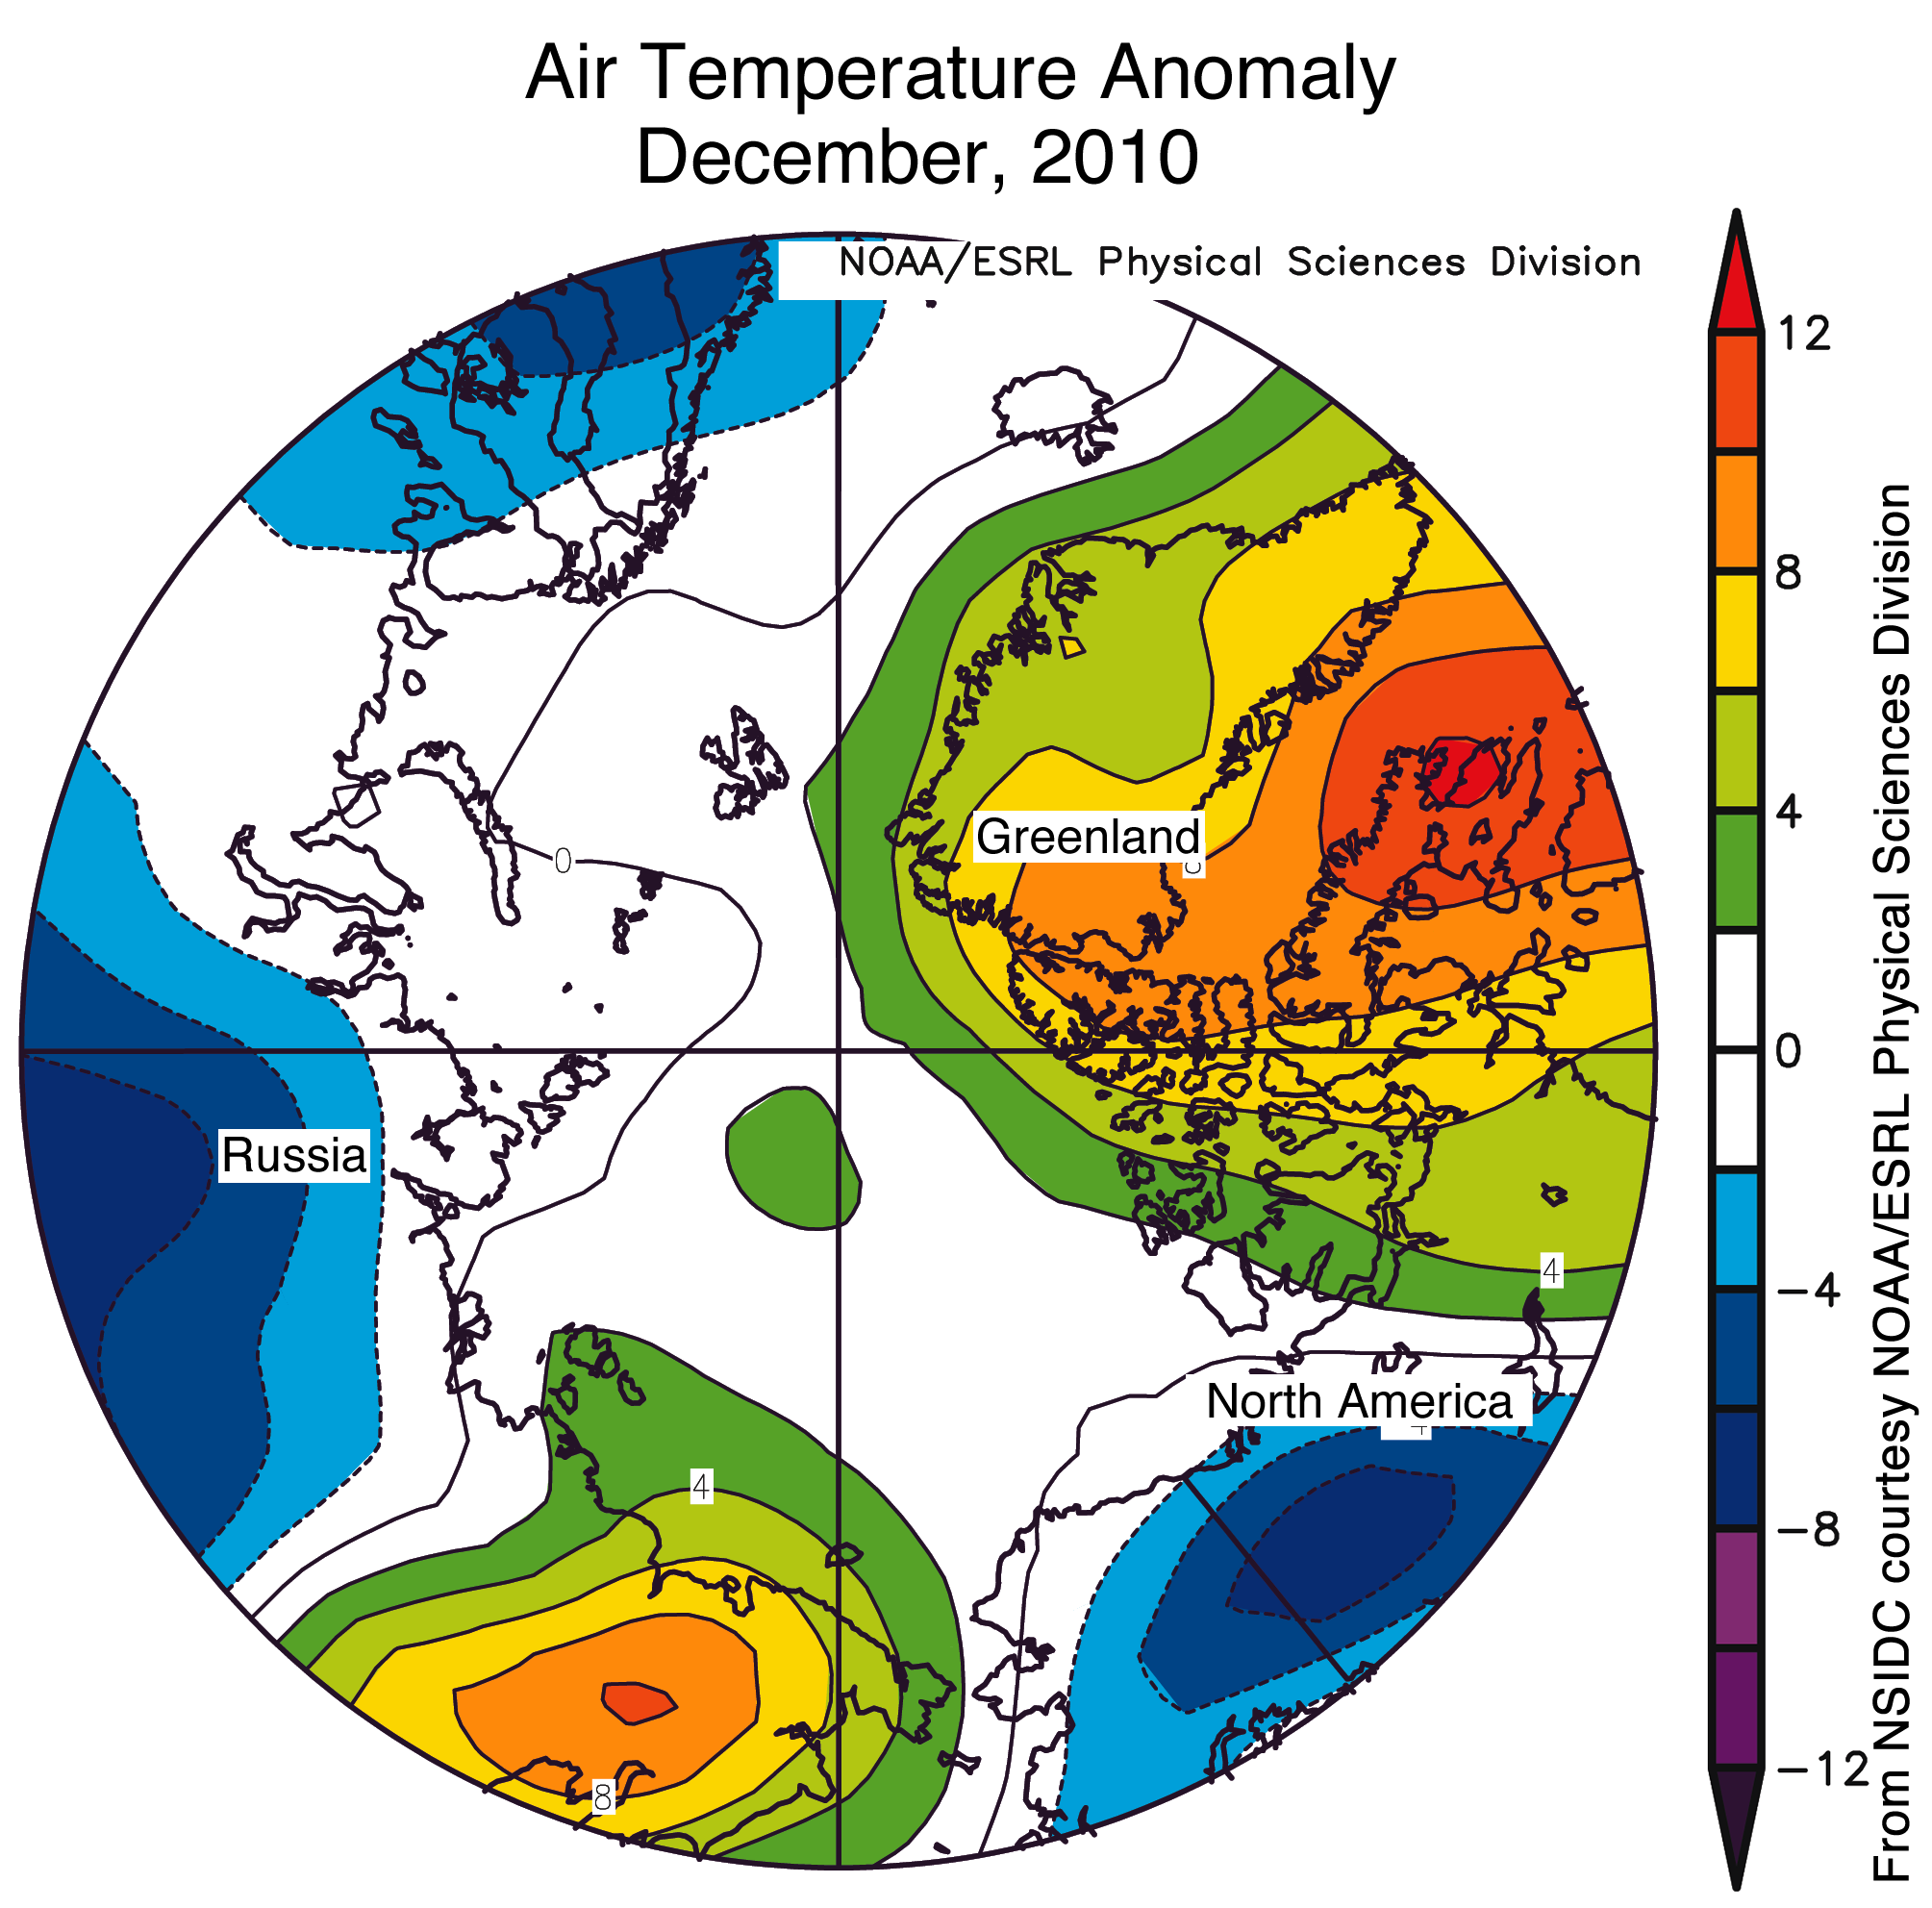
The low ice conditions in December occurred in conjunction with above-average air temperatures in regions where ice would normally expand at this time of year. Air temperatures over eastern Siberia were 6 to 10 degrees Celsius (11 to 18 degrees Fahrenheit) above normal in December. Over the eastern Canadian Arctic Archipelago, Baffin Bay/Davis Strait and Hudson Bay, temperatures were at least 6 degrees Celsius (11 degrees Fahrenheit) higher than average. Southern Baffin Island had the largest anomalies, with temperatures over 10 degrees Celsius (18 degrees Fahrenheit) higher than normal. By sharp contrast, temperatures were lower than average (4 to 7 degrees Celsius, 7 to 13 degrees Fahrenheit) over the Alaska-Yukon border, north-central Eurasia, and Scandinavia.
The warm temperatures in December came from two sources: unfrozen areas of the ocean continued to release heat to the atmosphere, and an unusual circulation pattern brought warm air into the Arctic from the south. Although the air temperatures were still below freezing on average, the additional ocean and atmospheric heat slowed ice growth.
Polar Amplification Effect & Current Polar Conditions
by John P. Reisman
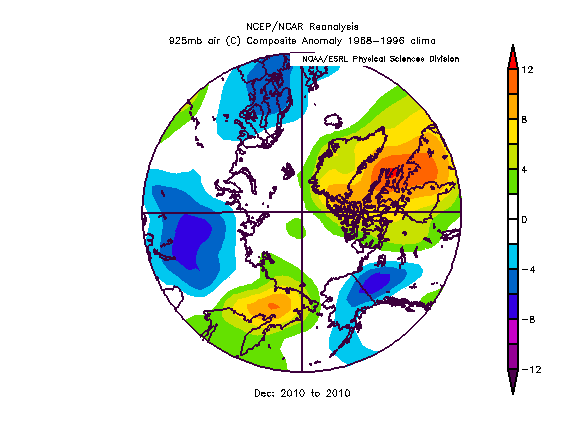
Relatively speaking the polar regions are anonymously high in temperature. The negative phase AO, which is a stronger high pressure variance in the Arctic, tends to push the cold polar air down into the lower latitudes. As pointed out in the NSIDC report (above): in December, eastern Siberia was 6 to 10 degrees Celsius (11 to 18 degrees Fahrenheit) above normal, while temperatures were lower than average (4 to 7 degrees Celsius, 7 to 13 degrees Fahrenheit) over the Alaska-Yukon border, north-central Eurasia, and Scandinavia.
Negative phase of the Arctic Oscillation
by NSIDC
As in December 2009, a strongly negative phase of the Arctic Oscillation dominated the middle and high latitudes of the Northern Hemisphere in December 2010, bringing higher-than-normal pressures to the Arctic region, with lower-than-normal pressures in middle latitudes. However, unlike 2009, when higher-than normal pressures centered near the central Arctic , in December 2010 higher pressures centered near Iceland and the eastern tip of the Aleutians in the Pacific, and yielded a different pattern of winds. As a result, different areas experienced warm anomalies in 2010, and a different pattern of ice extent emerged.
Our January 5, 2010 post discussed the connection between very warm temperatures over much of the high Arctic in December 2009 and a strongly negative phase of the Arctic Oscillation.
Figure 4. Air temperatures were higher than normal over Baffin Island, Hudson Bay, and eastern Siberia for the month of December, which was associated with low sea ice extent in those areas. The temperature pattern resulted from a negative phase of the Arctic Oscillation.
—Credit: NSIDC courtesy NOAA/ESRL PSD
Mass tree deaths prompt fears of Amazon ‘climate tipping point’
Scientists fear billions of tree deaths caused by 2010 drought could see vast forest turn from carbon sink to carbon source.

by guardian.co.uk, Thursday 3 February 2011 19.00 GMT
Aerial view of a drought-affected area within the Amazon basin in Manaus, Brazil. Photograph: Rodrigo Baleia/LatinContent/Getty Images
Billions of trees died in the record drought that struck the Amazon in 2010, raising fears that the vast forest is on the verge of a tipping point, where it will stop absorbing greenhouse gas emissions and instead increase them.
The dense forests of the Amazon soak up more than one-quarter of the world’s atmospheric carbon, making it a critically important buffer against global warming. But if the Amazon switches from a carbon sink to a carbon source that prompts further droughts and mass tree deaths, such a feedback loop could cause runaway climate change, with disastrous consequences.
Reps. Posey, Adams and Bishop Join Colleagues in Calling on House Leaders to Reprioritize NASA for Human Space Flight Missions, Drop Climate Change
Feb. 7, 2011 – John P. Reisman
This is roughly equivalent to a request for our government to bury it’s head in the sand; or a child’s announcement that if the child has his or her eyes closed, no one else can see him or her.
Moving forward under a constrained budget, it will be critical for the Appropriations Committee to produce legislation that is precise in its budget cuts. For years, Presidents and Congress have charged NASA with completing tasks that fall outside the scope of NASA’s primary mission. Specifically, NASA spent over 7.5% –– over a billion dollars –– of its budget on studying global warming/climate change in Fiscal Year 2010. In addition, the lion share of the stimulus funds NASA received went toward climate change studies. Excessive growth of climate change research has not been limited to NASA. Overall, the government spent over $8.7 billion across 16 agencies and Departments throughout the federal government on these efforts in FY 2010 alone. Global warming funding presents an opportunity to reduce spending without unduly impacting NASA’s core human spaceflight mission.
With your help, we can reorient NASA’s mission back toward human spaceflight by reducing funding for climate change research and reallocating those funds to NASA’s human spaceflight accounts, all while moving overall discretionary spending toward FY2008 levels.
Source: Reps. Bill Posey (R-Fla.), Sandy Adams (R-Fla.) and Rob Bishop (R-Utah)
House Energy & Commerce Committee pushes to repeal EPA’s authority to regulate greenhouse gases
Feb. 9, 20100 – By John P. Reisman
The House Energy & Commerce Committee met to discuss repealing the EPA’s authority to regulate greenhouse gases. The general claims that Senator Inhofe Representative Upton and Representative Whitfield present are interestingly normal. They claim the facts support their argument that the IPCC assessment is flawed and doing anything about greenhouse gases will not have a significant impact on the future. Senator Inhofe claims he is not there to debate the science, yet he claims that the science is flawed. This is a direct contradiction of course and clearly illustrates the hypocrisy of his statements. Point of fact, if he is not there to debate the science, how can he claim the science is flawed?
Excerpt from Senator Inhofe’s opening statement:
The draft bill, sponsored by me, Rep. Upton, and Rep. Whitfield, would repeal EPA’s authority to regulate greenhouse gases under the Clean Air Act. We’re doing this for one simple reason: EPA’s regulations will impose enormous costs for no meaningful benefits—in other words, all pain for no climate gain.
I have great respect for Administrator Jackson—she is doing what she thinks is right. But I think EPA is taking the wrong course. Let me explain.
Congress didn’t allow EPA to regulate greenhouse gases under the Clean Air Act. Administrator Jackson even agreed with the statement two years ago that the Clean Air Act “is not specifically designed to address greenhouse gases”.
We also know that EPA’s own analysis shows its actions won’t affect climate change, and the scientific basis of its endangerment finding, which the Administrator confirmed to me is the UN’s Intergovernmental Panel on Climate Change, or IPCC, is flawed.
Now I’m not here to debate science. So let’s assume—as I did during the Lieberman-Warner debate in the Senate—that predictions of more droughts, more floods, more intense storms, and more cases of disease are true. What we know is that EPA’s regulations won’t affect any of this.
EPA’s analysis of the Lieberman-Warner bill shows that, without aggressive action by China and India, cap-and-trade won’t reduce greenhouse gases by any meaningful amount. The EPA also found that its regulations covering CO2 from cars would reduce global temperatures by 0.006 degrees Celsius by 2100. In other words: no effect.
Now what if we added actions by other countries? Dr. Tom Wigley of the National Center for Atmospheric Research found that full implementation of Kyoto, including action by the U.S., Europe, Canada, Russia, and others, would reduce global temperature by, at most, 0.21 degrees Celsius by 2100. In other words, the Earth would warm about 6 percent less than it normally would. …
Source: energycommerce.house.gov/News
Source: Representative Upton’s Statement


