
National Climate Data Center Billion Dollar Weather/Climate Disasters; Climate change skepticism seeps into science classrooms

2011 saw a mix of more of the same in the climate debate and misunderstanding. While the science continues to reduce uncertainty in new and important areas, the basics remain the same. Near virtual certainty exists on the core of the scientific understanding regarding cause factors impacting the increase in radiative forcing that is causing global warming. There is no reasonable doubt that current warming is human influenced and largely human driven.
Billion Dollar Weather/Climate Disasters
![]()
National Climate Data Center
Source: https://www.ncdc.noaa.gov/oa/reports/billionz.html
—- 2011 (preliminary) —-
Economic damage costs to date in the US is approximately $52 Billion. Here is a preliminary summary of 12 U.S. Billion dollar disasters that have occurred so far in 2011:
Texas, New Mexico, Arizona Wildfires Spring-Fall 2011 Continued drought conditions and periods of extreme heat provided conditions favorable for a series of historic wildfires across Texas, New Mexico and Arizona. The Bastrop Fire in Texas was the most destructive fire in Texas history destroying over 1,500 homes. The Wallow Fire consumed over 500,000 acres in Arizona making it the largest on record in Arizona. The Las Conchas Fire in New Mexico was also the state’s largest wildfire on record scorching over 150,000 acres while threatening the Los Alamos National Laboratory. Over 3 million acres have burned across Texas this wildfire season. Total damage in Texas alone due to loss of property, timber and agriculture exceed $750 million. Losses for wildfire activity across all three states exceeds $1.0 billion; at least 5 U.S. deaths.
Hurricane Irene, August 20-29, 2011 Minimal Category 1 hurricane makes landfall over coastal NC and moved northward along the Mid-Atlantic Coast (NC, VA, MD, NJ, NY, CT, RI, MA, VT) causing torrential rainfall and flooding across the Northeast. Wind damage in coastal NC, VA, and MD was moderate with considerable damage resulting from falling trees and power lines, while flooding caused extensive flood damage across NJ, NY, and VT. Over seven million homes and businesses lost power during the storm. Numerous tornadoes were also reported in several states further adding to the damage. Over $7.3 billion in damages/costs; at least 45 deaths.
Upper Midwest Flooding, Summer, 2011 Melting of an above-average snow pack across the Northern Rocky Mountains combined with above-average precipitation caused the Missouri and Souris Rivers to swell beyond their banks across the Upper Midwest (MT, ND, SD, NE, IA, KS, MO). An estimated 11,000 people were forced to evacuate Minot, North Dakota due to the record high water level of the Souris River, where 4,000 homes were flooded. Numerous levees were breached along the Missouri River, flooding thousands of acres of farmland. Estimated losses exceed $2.0 billion. The flooding also stretched into the Canadian Prairies, where property and agriculture losses were expected to surpass $1.0 billion; at least 5 U.S. deaths.
Mississippi River flooding, Spring-Summer, 2011 Persistent rainfall (nearly 300 percent normal precipitation amounts in the Ohio Valley) combined with melting snowpack caused historical flooding along the Mississippi River and its tributaries. Estimated economic loss ranges from $3.0-4.0 billion; at least 2 deaths. Below are more detailed stats, which are still preliminary: $500 million to agriculture in Arkansas; $320 million in damage to Memphis, Tennessee; $800 million to agriculture in Mississippi; $317 million to agriculture and property in Missouri’s Birds Point-New Madrid Spillway; $80 million for the first 30 days of flood fighting efforts in Louisiana; at least 7 deaths.
Southern Plains/Southwest Drought and Heatwave, Spring-Fall, 2011 Drought and heatwave conditions created major impacts across Texas, Oklahoma, New Mexico, Arizona, southern Kansas, and western Louisiana. In Texas and Oklahoma, a majority of range and pastures were classified in ‘very poor’ condition for much of the 2011 crop growing season. The total direct losses to crops, livestock and timber approach $10.0 billion; both direct and total economic losses will rise as the drought continues.
Midwest/Southeast Tornadoes and Severe Weather June 18-22, 2011 Outbreak of tornadoes over central states (OK, TX, KS, NE, MO, IA, IL) with an estimated 81 tornadoes. Additional wind and hail damage across the Southeast (TN, GA, NC, SC). Over $1.0 billion insured losses; total losses greater than $1.3 billion and at least 3 deaths.
Midwest/Southeast Tornadoes, May 22-27, 2011 Outbreak of tornadoes over central and southern states (MO, TX, OK, KS, AR, GA, TN, VA, KY, IN, IL, OH, WI, MN, PA) with an estimated 180 tornadoes and at least 177 deaths. Notably, an EF-5 tornado struck Joplin, MO resulting in at least 160 deaths, making it the deadliest single tornado to strike the U.S. since modern tornado record keeping began in 1950. Over $6.5 billion insured losses for event; total losses greater than $9.1 billion; 177 deaths.
Southeast/Ohio Valley/Midwest Tornadoes, April 25-30, 2011 Outbreak of tornadoes over central and southern states (AL, AR, LA, MS, GA, TN, VA, KY, IL, MO, OH, TX, OK) with an estimated 343 tornadoes and 321 deaths. Of those fatalities, 240 occurred in Alabama. The deadliest tornado of the outbreak, an EF-5, hit northern Alabama, killing 78 people. Several major metropolitan areas were directly impacted by strong tornadoes including Tuscaloosa, Birmingham, and Huntsville in Alabama and Chattanooga, Tennessee, causing the estimated damage costs to soar. Over $7.3 billion insured losses; total losses greater than $10.2 billion; 321 deaths.
Midwest/Southeast Tornadoes, April 14-16, 2011 Outbreak of tornadoes over central and southern states (OK, TX, AR, MS, AL, GA, NC, SC, VA, PA) with an estimated 177 tornadoes. Despite the large overall number of tornadoes, few were classified as intense, with just 14 EF-3, and no EF-4 or EF-5 tornadoes identified. Over $1.4 billion insured losses; total losses greater than $2.1 billion; 38 deaths [22 of which were in North Carolina].
Southeast/Midwest Tornadoes, April 8-11, 2011 Outbreak of tornadoes over central and southern states (NC, SC, TN, AL, TX, OK, KS, IA, WI) with an estimated 59 tornadoes. Over $1.5 billion insured losses; total losses greater than $2.2 billion; numerous injuries, 0 deaths.
Midwest/Southeast Tornadoes, April 4-5, 2011 Outbreak of tornadoes over central and southern states (KS, MO, IA, IL, WI, KY, GA, TN, NC, SC) with an estimated 46 tornadoes. Over $2.0 billion insured losses; total losses greater than $2.8 billion; 9 deaths.
Groundhog Day Blizzard, Jan 29-Feb 3, 2011 A large winter storm impacting many central, eastern and northeastern states. The city of Chicago was brought to a virtual standstill as between 1 and 2 feet of snow fell over the area. Insured losses greater than $1.0 billion; total losses greater than $1.8 billion; 36 deaths.
Climate change skepticism seeps into science classrooms
By Neela Banerjee, Washington Bureau January 16, 2012
Some states have introduced education standards requiring teachers to defend the denial of man-made global warming. A national watchdog group says it will start monitoring classrooms.
Texas and Louisiana have introduced education standards that require educators to teach climate change denial as a valid scientific position. South Dakota and Utah passed resolutions denying climate change. Tennessee and Oklahoma also have introduced legislation to give climate change skeptics a place in the classroom.
Source: Los Angeles Times
Conflation and misconstruction as modus operendi?
I often wonder at just how expert one can be in getting it all wrong? It’s not a field of study, it’s an inability to see the forest for the trees. This months winners for missing the point seem to be Judith Curry and Roger Pielke Sr. They continue to put their arguemnts together incorrectly and generally get it wrong.
Comment On Gavin Schmidt’s Post On His Weblog Real Climate Regarding The Dominate Role Of Anthropogenic Greenhouse Gas Concentrations On The Global Average Temperature Trends

Gavin Schmidt has presented information in his weblog post on Real Climate titled
which is incomplete and misleading.
His post starts with the text [highlight added]
Back in 2007, the IPCC AR4 SPM stated that:
“Most of the observed increase in global average temperatures since the mid-20th century is very likely due to the observed increase in anthropogenic greenhouse gas concentrations.”
This is a clear statement that I think is very well supported and correctly reflects the opinion of most climate scientists on the subject (and was re-affirmed in two recent papers (Jones and Stott, 2011;, Huber and Knutti, 2011)). It isn’t an isolated conclusion from a single study, but comes from an assessment of the changing patterns of surface and tropospheric warming, stratospheric cooling, ocean heat content changes, land-ocean contrasts, etc. that collectively demonstrate that there are detectable changes occurring which we can attempt to attribute to one or more physical causes.
He persists is using multi-decadal global model predictions as the tool to claim that the cause of global average temperatures increases over the last 50 years or so can mostly be explained by the increase in anthropogenic greenhouse gas concentration [and when he says “global average” he means “global annual average“] . In our article
Pielke Sr., R., K. Beven, G. Brasseur, J. Calvert, M. Chahine, R. Dickerson, D. Entekhabi, E. Foufoula-Georgiou, H. Gupta, V. Gupta, W. Krajewski, E. Philip Krider, W. K.M. Lau, J. McDonnell, W. Rossow, J. Schaake, J. Smith, S. Sorooshian, and E. Wood, 2009: Climate change: The need to consider human forcings besides greenhouse gases. Eos, Vol. 90, No. 45, 10 November 2009, 413. Copyright (2009) American Geophysical Union
we wrote
Unfortunately, the 2007 Intergovernmental Panel on Climate Change (IPCC) assessment did not sufficiently acknowledge the importance of these other human climate forcings in altering….. global climate ……… It also placed too much emphasis on average global forcing from a limited set of human climate forcings.
To this we should add that “the 2007 Intergovernmental Panel on Climate Change (IPCC) assessment did not sufficiently acknowledge the importance of NATURAL climate forcings in altering….. global climate ………”
Actually, it is straightforward to shed doubt on Gavin’s (and the IPCC) claim. If the increase in anthropogenic greenhouse gas concentration were so dominate we would expect the global average [annual] lower troposphere temperature to more-or less monotonically continue to rise in the last decade or so. This clearly has not occurred, as illustrated, for example, in the figure below for the lower troposphere [from RSS; Figure 7]

and from the UAH analysis (see)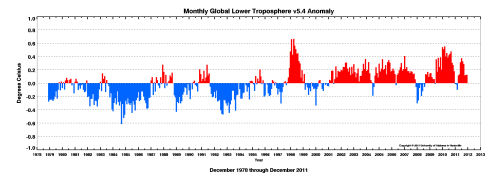
The first tic mark on the x-axis in the RSS figure is 1979.
The lower tropospheric ~global annual average lower tropospheric temperatures have been essentially flat for at least 10 years, presumably due to other human climate forcings, solar forcing, decadal and longer natural variability and/or radiative feedbacks.
If Gavin were correct, we should also see the lower stratosphere continue to cool. As shown below (from RSS, figure 7), there has been no significant cooling for over 17 years!

Gavin is failing to see this complexity in the climate system. It is quite puzzling as most all climate scientist accept a positive radiative forcing from the human addition of greenhouse gases, but many of us do not accept that is the only first order effect, nor that it is the most dominate in terms of the effect of these forcings on society and the environment.
He may yet be correct for 50 year time scales, but the recent evidence he refers to is actually working to refute his hypothesis.
In this context, he also has ignored the implications from the recent Loeb et al 2012 paper which posted on;
In that post, I wrote
Jim Hansen concluded in 2005 that the decadal mean planetary energy imbalance at the end of the 1990s was
,…..0.85 Watts per meter squared is the imbalance at the end of the decade.”
This value falls within the uncertainty range of the Leob et al 2012 study. However, we are 13 years since the end of the 20th century, so Jim Hansen’s value for the imbalance must be larger (~0.95 Watts per meter squared from GISS?).
This question about whether or not the IPCC model predictions (as represented by the GISS models) are still consistent even with the large Loeb et al estimate should have been a major part of their article. The Loeb et al 2012 even cited the Hansen paper but did not take the next step and complete model and observational comparisons. That the IPCC models are close to being refuted with respect to the magnitude of global warming even with the large Loeb et al values is an unspoken result of their findings. They missed a major implication from their results.
Gavin is very selective when he seeks to defend the dominance of anthropogenic greenhouse gases with respect to global annual average temperature changes. In reality, Gavin’s conclusion on the role of the anthropogenic emissions of greenhouse gases as dominating changes in climate statistics is close to being refuted.
Gavin Responds to Pielke Seniors Conflation:
“In reality, Gavin’s conclusion on the role of the anthropogenic emissions of greenhouse gases as dominating changes in climate statistics is close to being refuted.”
[Response: What a strange comment. It mixes up projections with hindcasts, conflates the IPCC statement with a strawman that no other factors have any effect, and finishes up with an apparent claim that because there is month to month variability in the MSU data, the long term trends are not attributable. Plus the confusion about the dominant factors in MSU4 (hint, it isn’t CO2). – gavin]
Judith Curry Defends Her Ambiguity And Lack Of Understanding
Judith Curry and P.J. Webster put out a new paper in BAMS (the American Meteorological Society) journal and did a greawt job of muddling up some very important issues. The point is well made by Gavin Schmit on RealClimate.
https://www.realclimate.org/index.php/archives/2012/01/the-ar4-attribution-statement/
Gavins comments on related issues can be found here:
https://www.collide-a-scape.com/2010/08/03/the-curry-agonistes/#comment-13587