
Atmosphere
- Contents
| Note: Missing graphics may be due to temporary server maintenance (or the occasional gov. shutdown). |
Daily Outgoing Long Wave Radiation (OLR) Plot
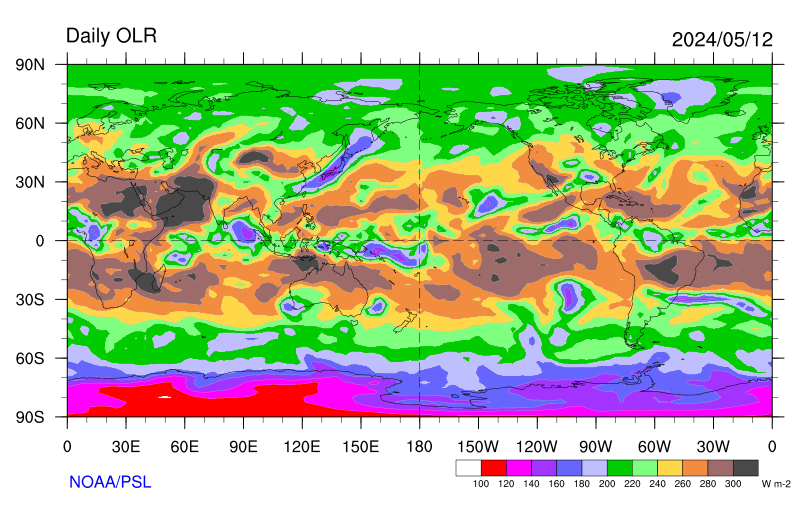
Source: NOAA Earth System Research Laboratory
Daily OLR Anomaly Plot
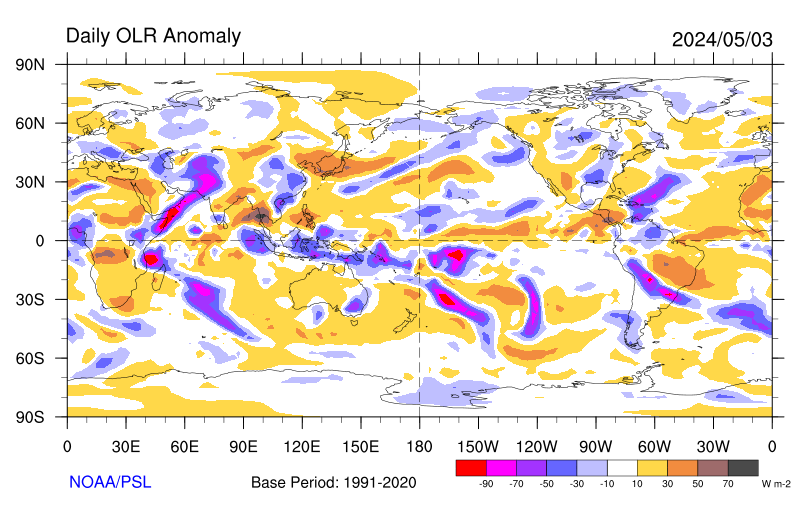
Source: NOAA Earth System Research Laboratory
Weekly Outgoing Long Wave Radiation (OLR) Plot
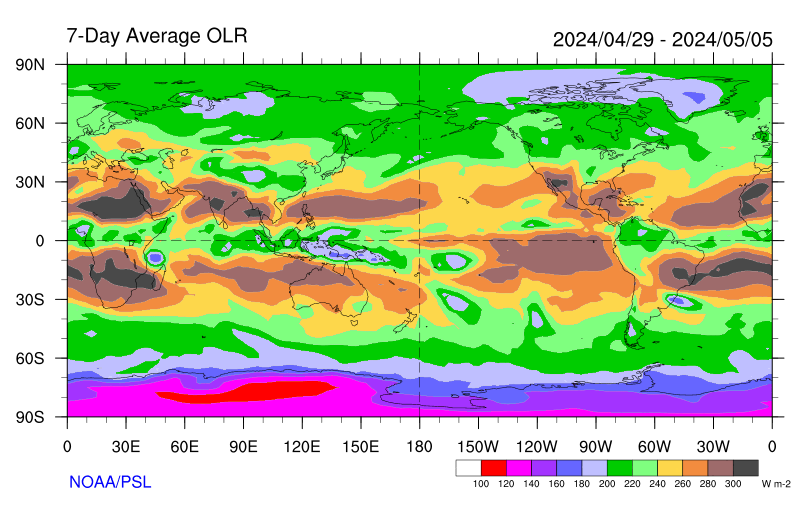
Source: NOAA Earth System Research Laboratory
Weekly OLR Anomaly Plot
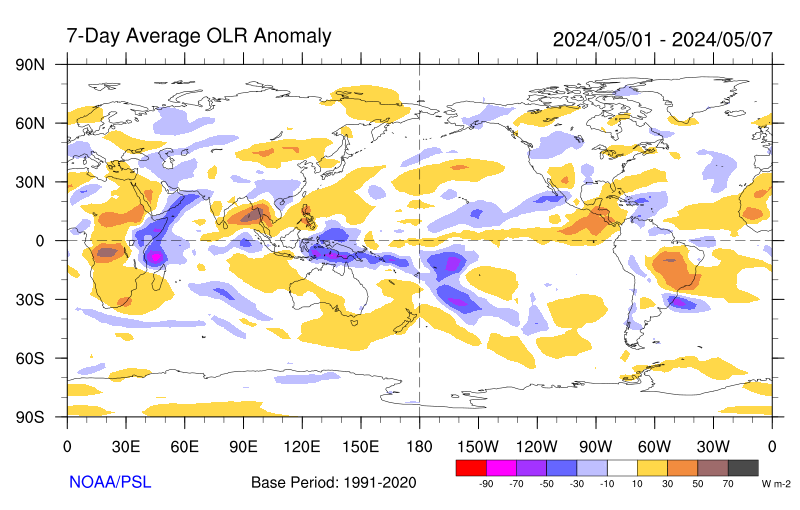
Source: NOAA Earth System Research Laboratory
Monthly Outgoing Long Wave Radiation (OLR) Plot
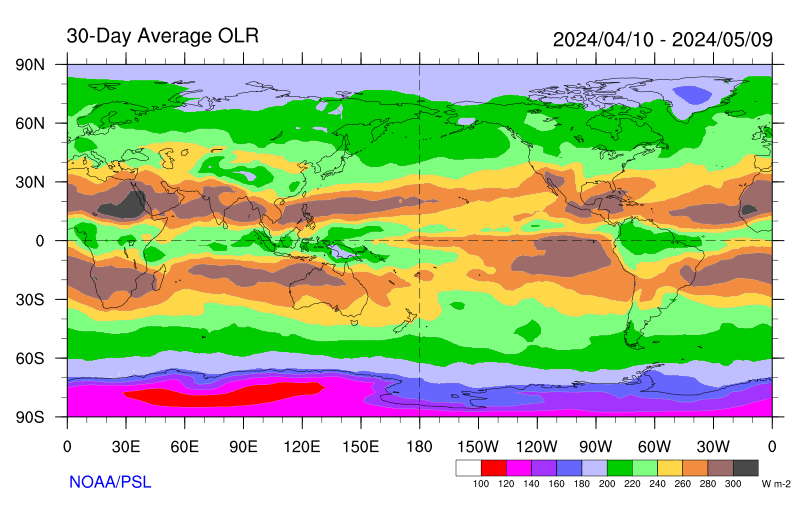
Source: NOAA Earth System Research Laboratory
Monthly OLR Anomaly Plot
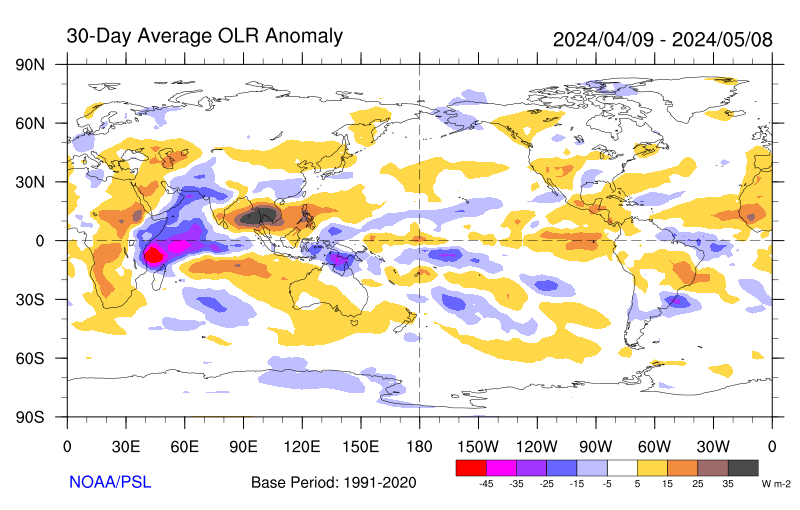
Source: NOAA Earth System Research Laboratory
Seasonal Outgoing Long Wave Radiation (OLR) Plot
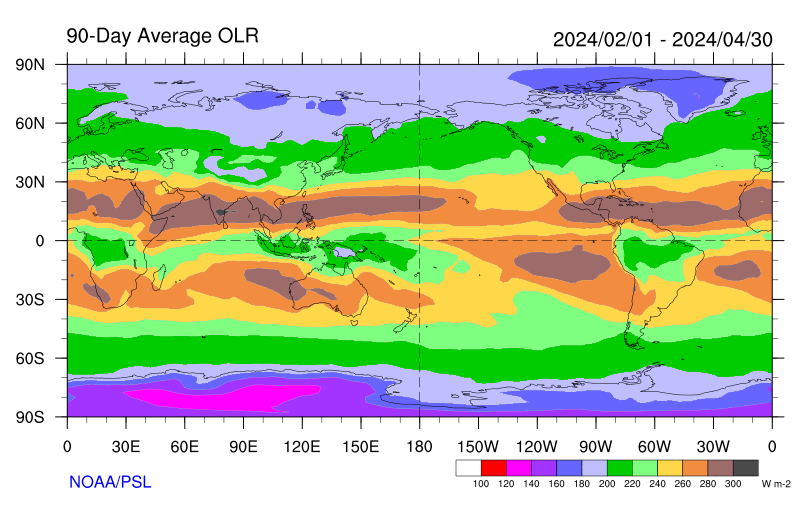
Source: NOAA Earth System Research Laboratory
Seasonal OLR Anomaly Plot
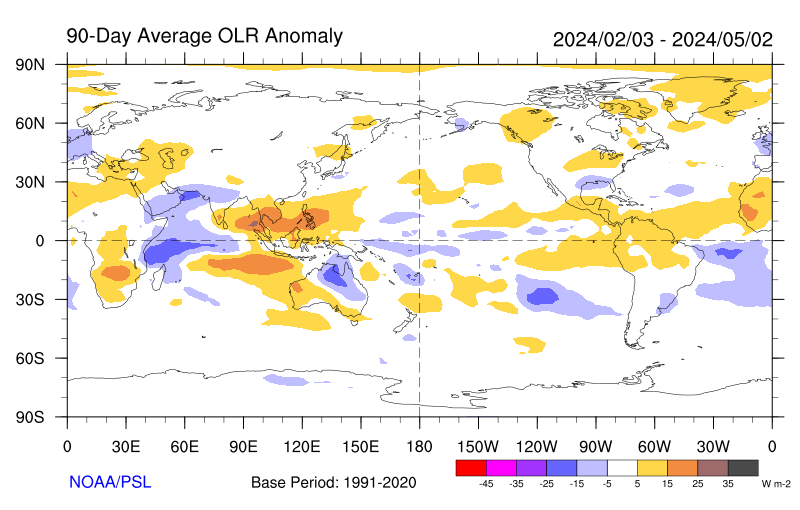
Source: NOAA Earth System Research Laboratory
Animations
Intra-seasonal Oscillations
5-Day Means 200-hPa Heights and Wind Speed
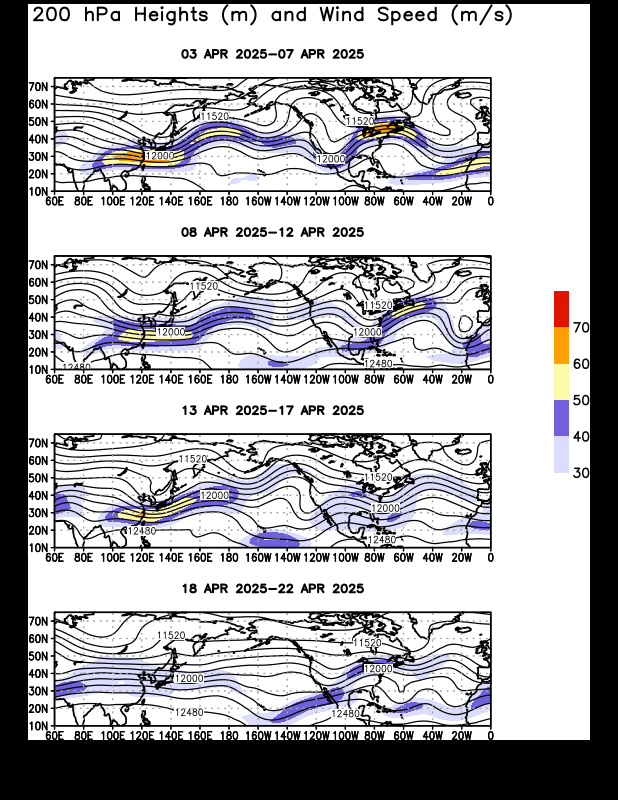
Source:
500-hPA Heights and Anomalies
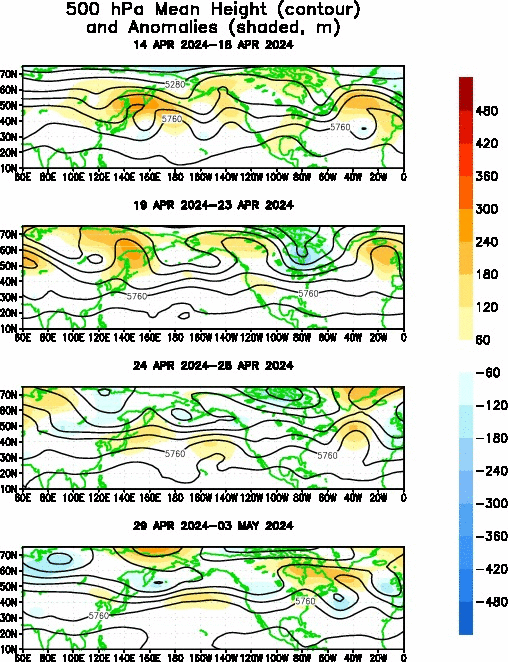
Source: https://www.cpc.ncep.noaa.gov/products/intraseasonal/
Time-Longitude Sections
Equatorial
Filtered OLR Anomalies (5°S-5°N)
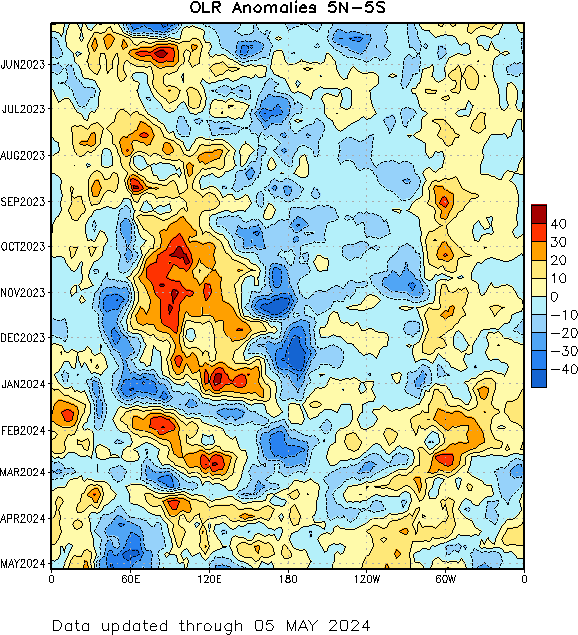
Source: https://www.cpc.ncep.noaa.gov/products/intraseasonal/
200-hPa Velocity Potential (5°S-5°N)
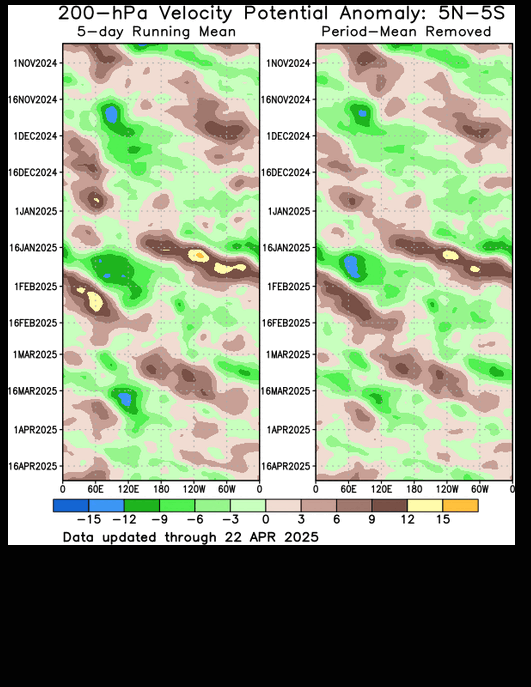
Source: https://www.cpc.ncep.noaa.gov/products/intraseasonal/
850-hPa Zonal Wind Anomalies (5°S-5°N)
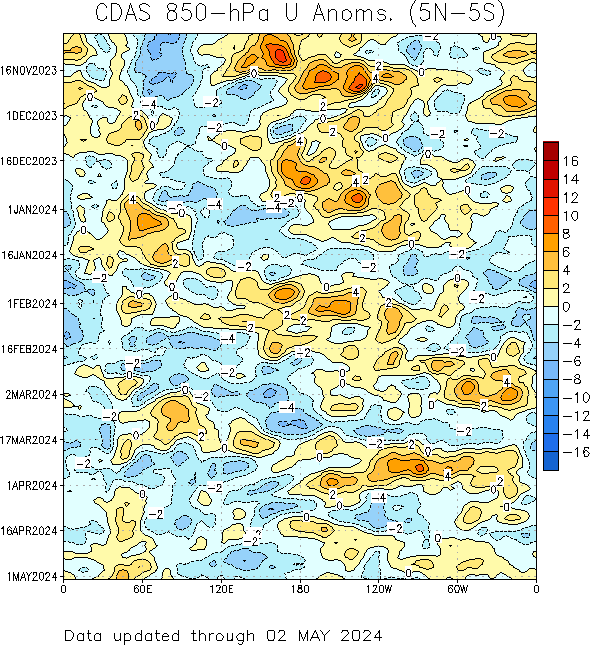
Source: https://www.cpc.ncep.noaa.gov/products/intraseasonal/
30-day 200-hPa Heights
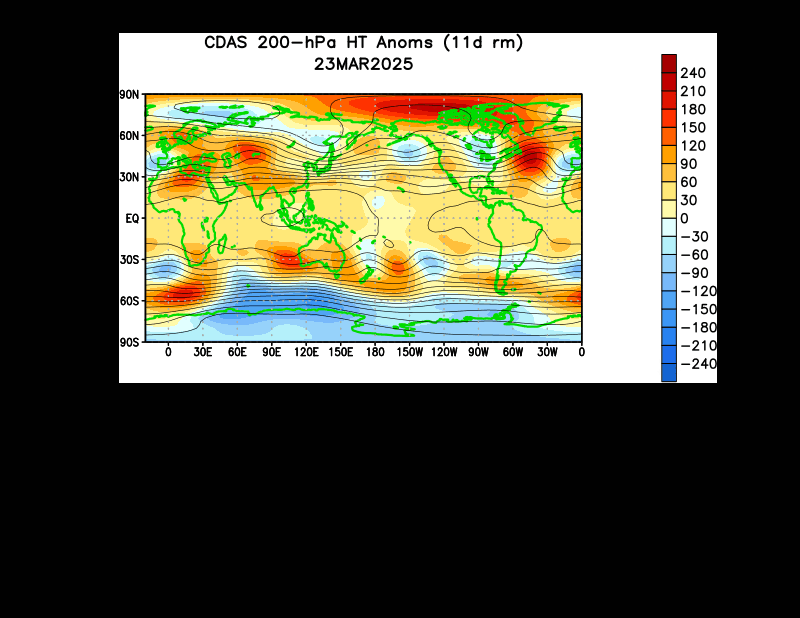
Source: https://www.cpc.ncep.noaa.gov/products/intraseasonal/
30-day 500-hPa Heights
Northern Hemisphere
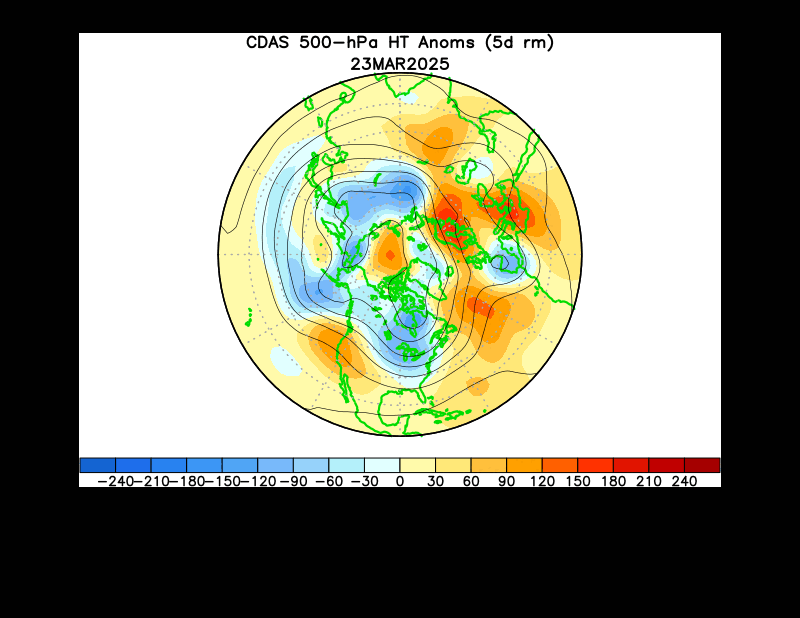
Source: https://www.cpc.ncep.noaa.gov/products/intraseasonal/
Southern Hemisphere

Source: https://www.cpc.ncep.noaa.gov/products/intraseasonal/
Mid-Latitude
- 500-hPa Height Anomalies (45°N-60°N)
- 500-hPa Height Anomalies (45°S-60°S)
High-Latitude
- 500-hPa Height Anomalies (60°N-90°N)
- 500-hPa Height Anomalies (60°S-90°S)
Winds
Surface Winds
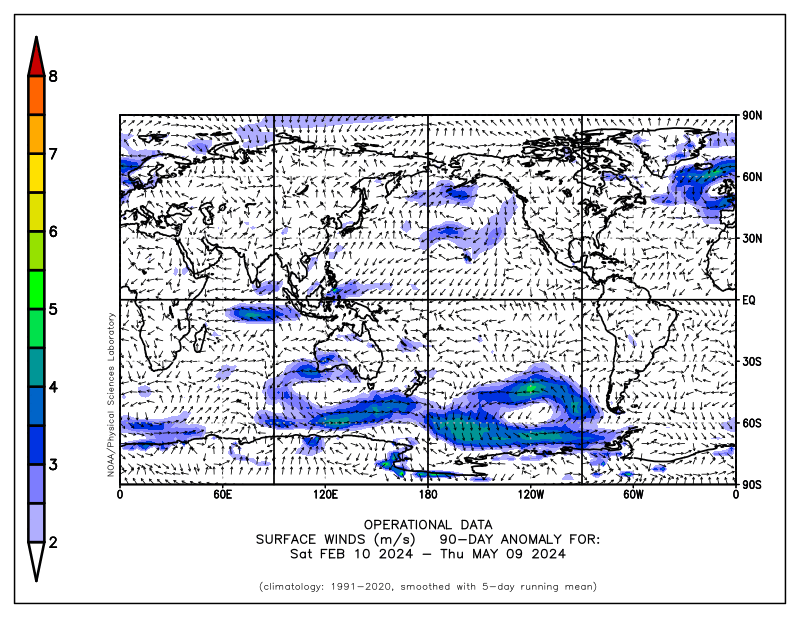
Source: NOAA Earth System Research Laboratory
250mb Winds

Source: NOAA Earth System Research Laboratory
Sea Level Pressure (SLP)
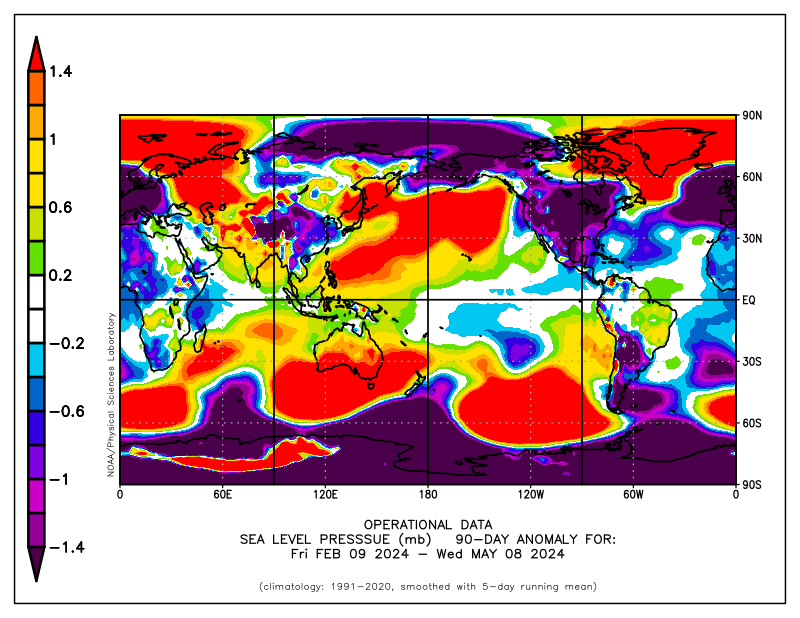
Source: NOAA Earth System Research Laboratory
500mb Geopotential Heights
500mb Geopotential Heights 90-day Mean
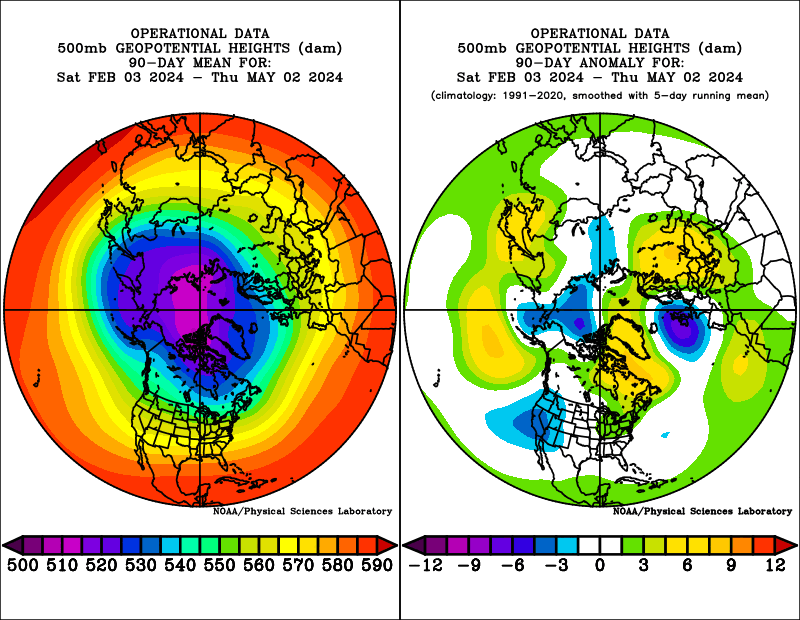
Source: NOAA/ESRL
Global Wind Oscillation (GWO) Phase Plot
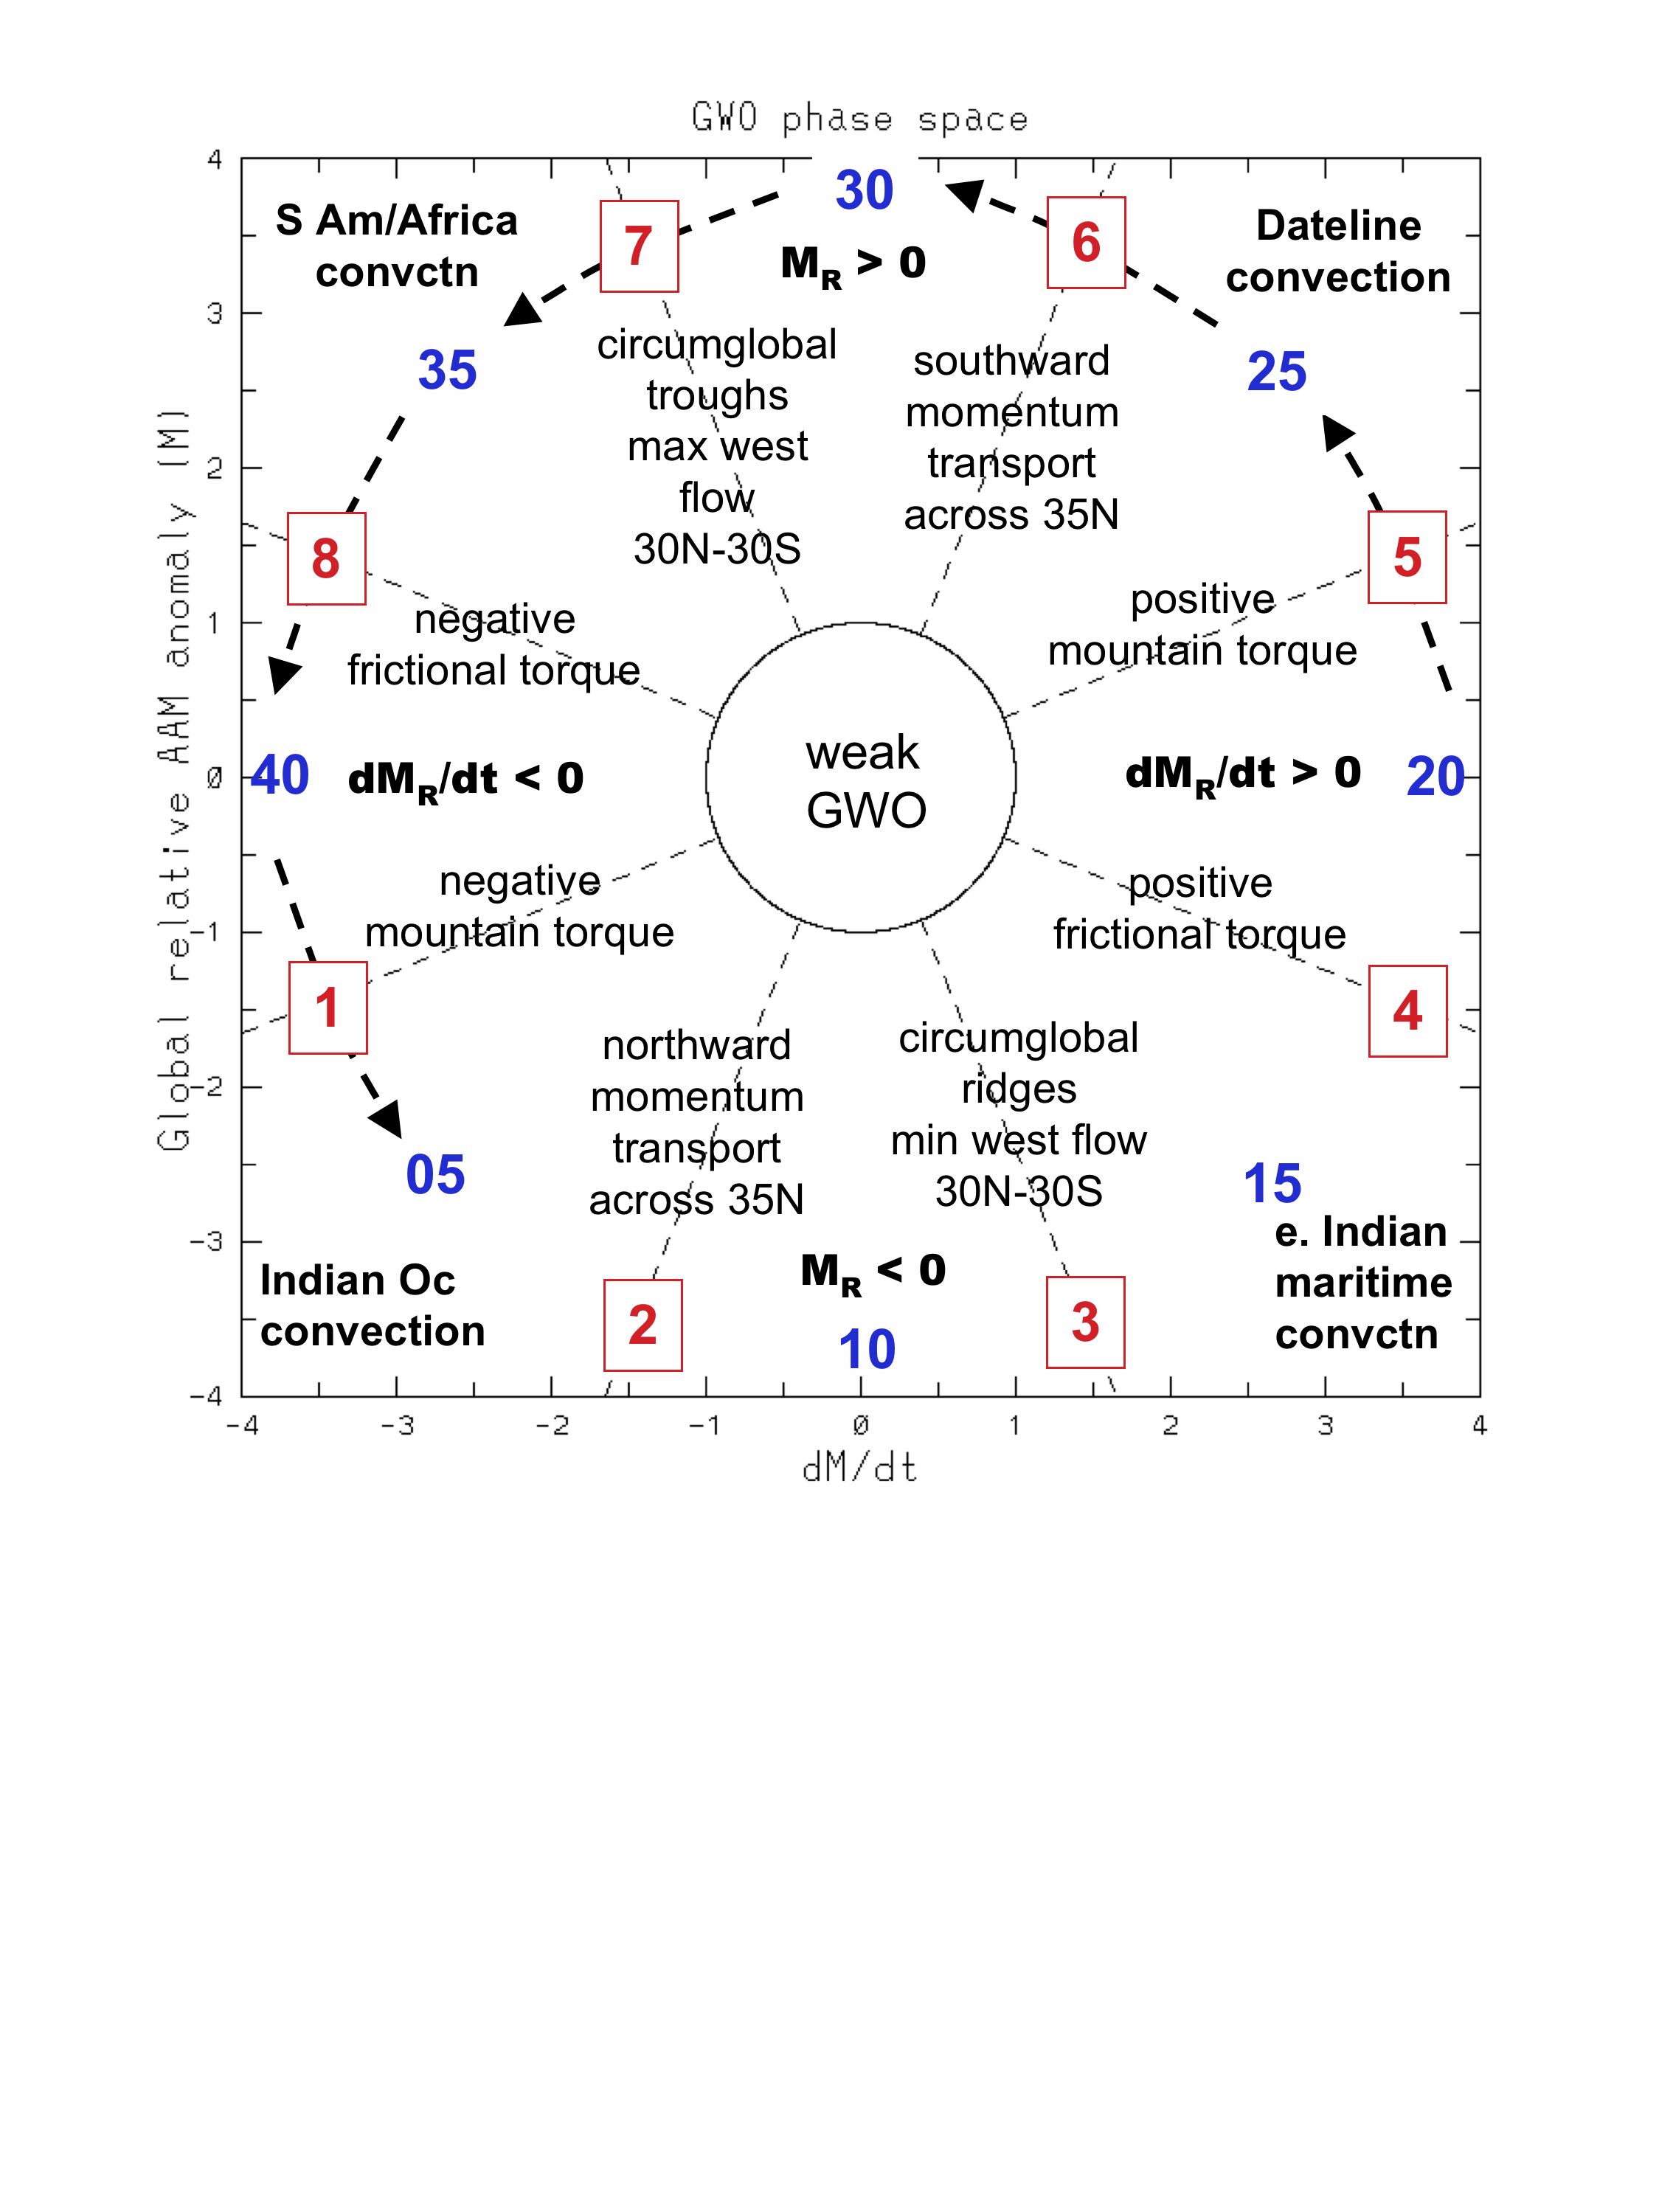
Source: https://www.esrl.noaa.gov/psd/map/clim/test_maproom.html