Temperature
- Contents
| Note: Missing graphics may be due to temporary server maintenance (or the occasional gov. shutdown). |
TEMPERATURE
Land/Ocean and Hemisphere Global Trends
Global Annual Mean Surface Air Temperature Change


Line plot of global mean land-ocean temperature index, 1880 to present, with the base period 1951-1980. The dotted black line is the annual mean and the solid red line is the five-year mean. The green bars show uncertainty estimates. [This is an update of Fig. 1A in Hansen et al. (2006).]
Figure also available as PDF, or Postscript. Also available are tabular data.
Source: https://data.giss.nasa.gov/gistemp/graphs_v3/
Graph: https://data.giss.nasa.gov/gistemp/graphs_v3/Fig.A2.gif
Northern Hemisphere (NH), Southern (SH) Temperature Trends (GMT)

Annual and five-year running mean temperature changes with the base period 1951-1980 for the northern (red) and southern (blue) hemispheres.
Figure also available as PDF, or Postscript, Also available is a table.
Source: https://data.giss.nasa.gov/gistemp/graphs_v3/
Graph: https://data.giss.nasa.gov/gistemp/graphs_v3/Fig.A3.gif
Annual Mean Temperature Change for Three Latitude Bands

Annual and five-year running mean temperature changes, with the base period 1951-1980, for three latitude bands that cover 30%, 40% and 30% of the global area. Uncertainty bars (95% confidence limits) are based on spatial sampling analysis. [This is an update of Figure 5 in Hansen et al. (1999).]
Figure also available as PDF, or Postscript, Also available is a table.
Source: https://data.giss.nasa.gov/gistemp/graphs_v3/
Graph: https://data.giss.nasa.gov/gistemp/graphs_v3/Fig.B.gif
Sea Surface Temperature (SST)
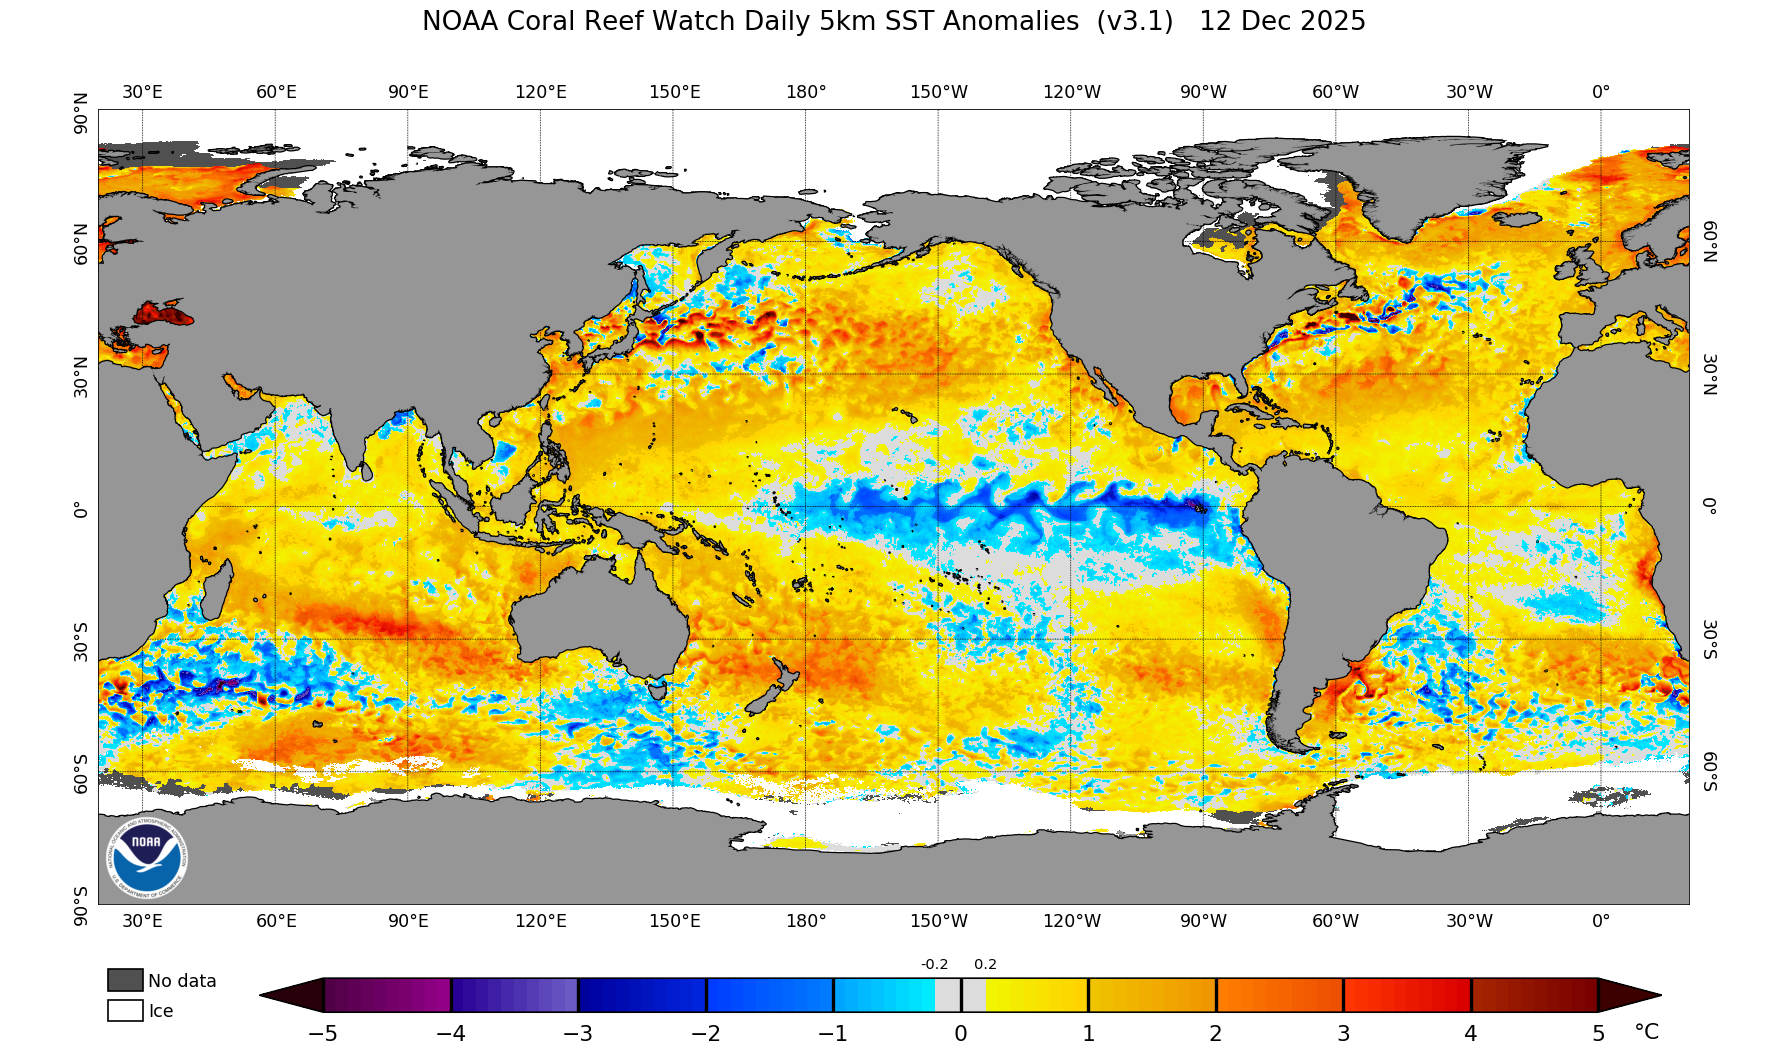
https://www.ospo.noaa.gov/Products/ocean/sst/anomaly/index.html
Sea Surface Height (SSH)
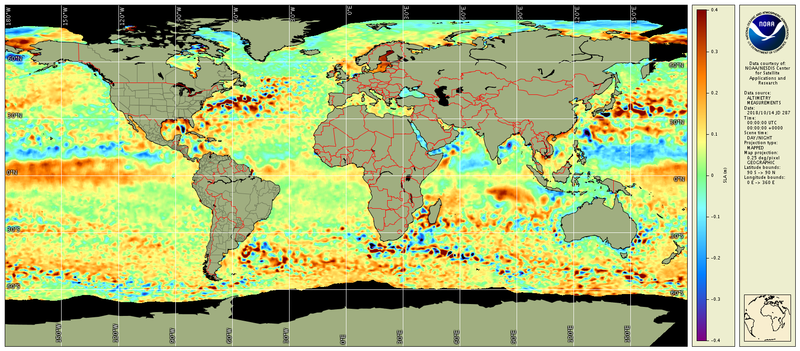
Land Ocean Temperature & Anomalies
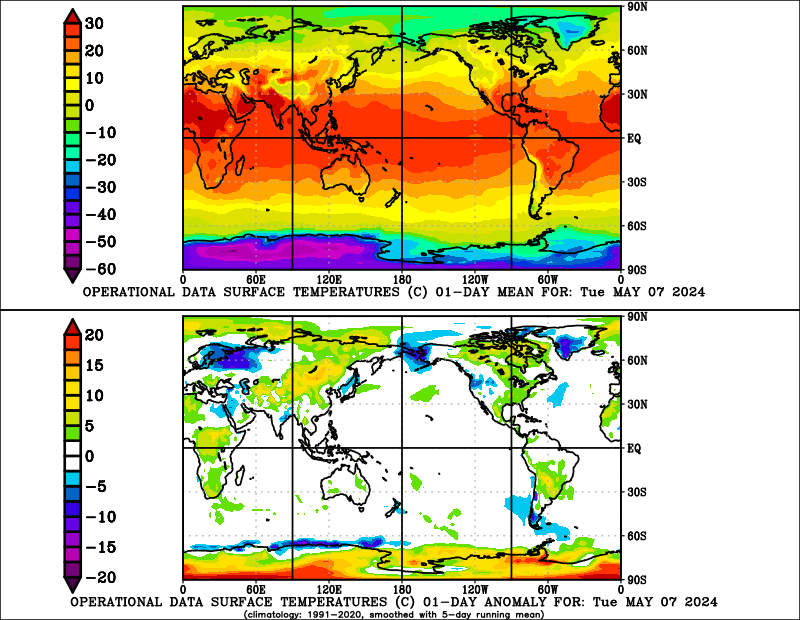
Global Temperature (1-day average)
Upper Chart is Temperature
Lower Chart is Anomaly
Source: ESRL/NOAA
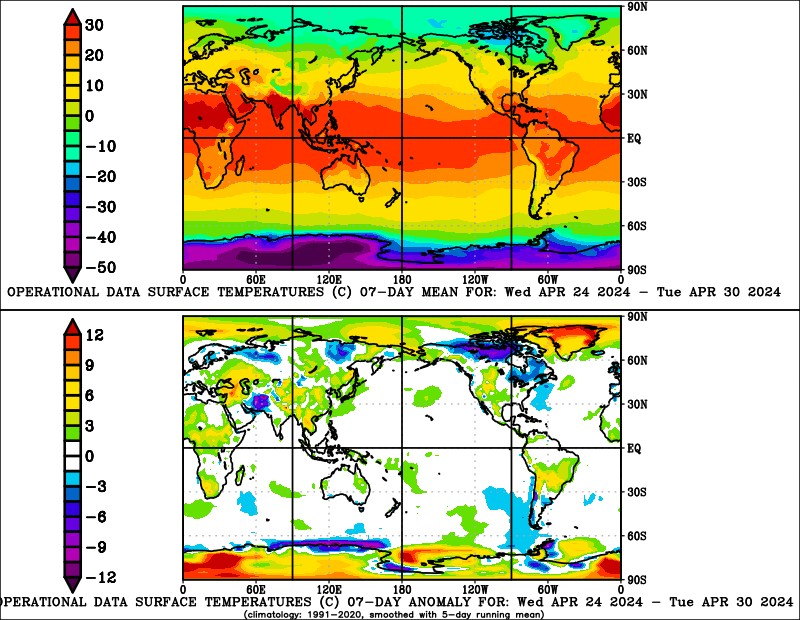
Global Surface Temperature (7-day average)
Upper Chart is Temperature
Lower Chart is Anomaly
Source: ESRL/NOAA
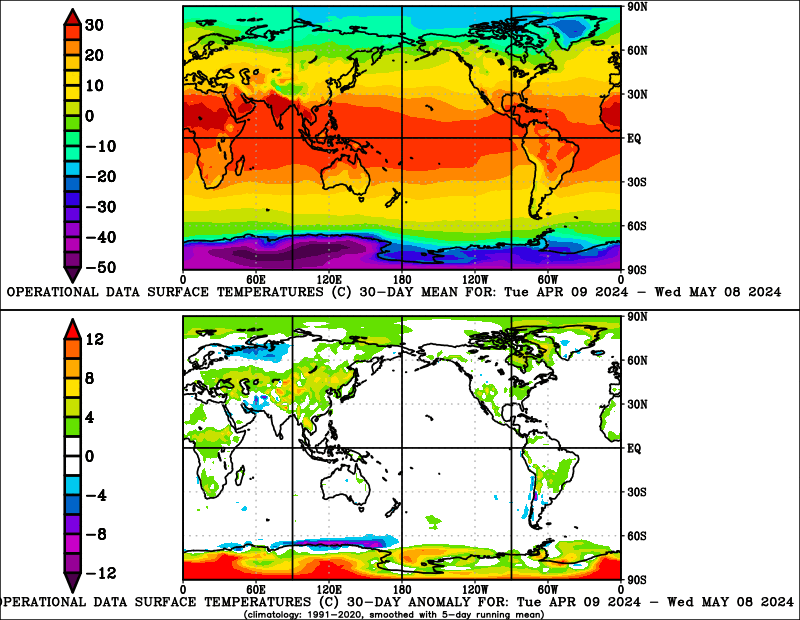
Global Surface Temperature (30-day average)
Upper Chart is Temperature
Lower Chart is Anomaly
Source: ESRL/NOAA
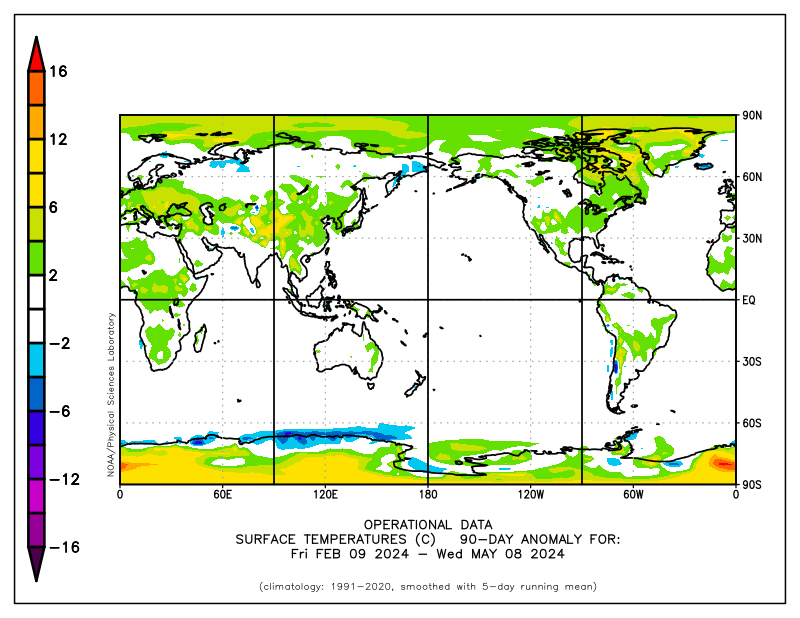
Global Surface Temperature (90-day average)
Upper Chart is Temperature
Lower Chart is Anomaly
Source: NOAA Earth System Research Laboratory
United States
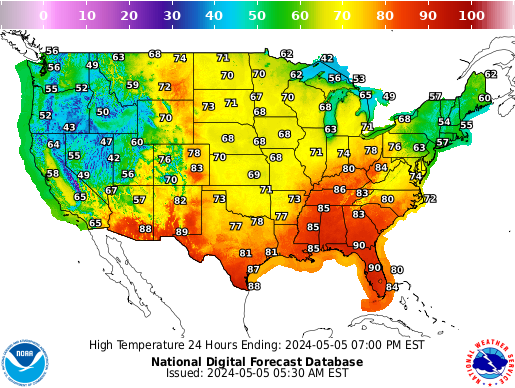
Source: NOAA/NWS (National Weather Service)

