- Home
- Projects
- Education
- TLC/PATH
- Economy
- Energy
- Environment
- The Leading Edge
- Global Warming
- Links
- Current Climate Conditions
- Summary Reports
- Myths vs. Facts: Global Warming
- 1500 Year Climate Cycle
- 1934 is the Hottest Year on Record
- 31,000 scientists say “no convincing evidence”.
- 40’s to 70’s cooling, CO2 rising?
- A Real Climate Assessment
- Antarctica is Cooling/Gaining Ice
- Bob Carter
- Lord Christopher Monckton
- CO2 Lag
- CO2 is Plant Food
- CO2 is Not a Pollutant
- ClimateGate
- The Copenhagen Distraction
- Denialist vs. Skeptic
- The Denial Machine
- Ferenc Miskolcz
- Global Cooling Myth in the 70’s
- Glenn Beck
- Global Warming Stopped in 1998
- Global Warming Stopped, Again (2013)
- Global Warming is Only Part Human Caused
- The Great Global Warming Swindle
- Henrik Svensmark
- Hidden Code, Data, Raw Data
- The Hockey Stick Controversy
- John Coleman
- Ian Plimer
- Loehle Temperature Reconstruction
- It’s the Sun!
- Medieval Warm Period
- Models Can Be Wrong
- Ocean Cooling
- The Revelle Gore Story
- Richard Lindzen
- Roger Pielke Sr.
- Ross McKitrick – The McKi ‘trick’
- S. Fred Singer
- Station Drop Out
- Troposphere Not Warming
- Volcanoes Emit more CO2 than Mankind
- Understanding the Denialist Sytle of Argument
- 1500 Year Climate Cycle
- 1958 – Frank Capra warns of Global Warming
- 1989 – Margaret Thatcher
- 2009 – Chancellor Angela Merkel before the US Congress
- Arctic Oscillation (AO)
- Arctic Ice Melt
- Arctic/Polar Amplification Effect
- Antarctic Ice Melt
- Antarctic Oscillation (AAO)
- Atlantic Multidecadal Oscillation (AMO)
- Atmospheric Aerosols
- Atmospheric Circulation
- Atmospheric Composition
- Attribution
- Brewer Dobson Circulation
- Climate Models
- Climate Feedback/Sensitivity
- Climate Forcing
- Context is Key
- Dansgaard Oeschger Events
- Empirical: Modeling v. Observations
- Earth’s Radiation Budget
- Galactic Cosmic Rays
- Greenhouse Gases/Effect
- Greenland Ice Melt
- History of Climate Science
- Human Caused Global Warming
- IPCC Reports
- Keeling Curves
- Latitudinal Shift
- Maunder Minimum
- Medieval Warm Period
- Methane & Hydrate/Clathrate
- Milankovitch Cycles
- Natural Cycle-Global Warming
- Natural Variation
- North Atlantic Oscillation (NAO)
- El Nino Southern Oscillation (ENSO)
- Pacific Decadal Oscillation (PDO)
- Pacific/North American Pattern (PNA)
- Southern Oscillation Index (SOI)
- Risk Analysis
- Sea Level Rise Research Summary
- Security Implications
- Solar Influence
- Temperature (Global)
- Thermal Inertia (Oceanic)
- Tipping Points
- Weather Intensity
- Weather v. Climate
- What We Know
- What We Can Do About Global Warming
- What We Don’t Know
- Services
- Our View
- About
- Holding Tab
Temperature
- Contents
| Note: Missing graphics may be due to temporary server maintenance (or the occasional gov. shutdown). |
TEMPERATURE
Land/Ocean and Hemisphere Global Trends
Global Annual Mean Surface Air Temperature Change
Line plot of global mean land-ocean temperature index, 1880 to present, with the base period 1951-1980. The dotted black line is the annual mean and the solid red line is the five-year mean. The green bars show uncertainty estimates. [This is an update of Fig. 1A in Hansen et al. (2006).]
Figure also available as PDF, or Postscript. Also available are tabular data.
Source: https://data.giss.nasa.gov/gistemp/graphs_v3/
Graph: https://data.giss.nasa.gov/gistemp/graphs_v3/Fig.A2.gif
Northern Hemisphere (NH), Southern (SH) Temperature Trends (GMT)
Annual and five-year running mean temperature changes with the base period 1951-1980 for the northern (red) and southern (blue) hemispheres.
Figure also available as PDF, or Postscript, Also available is a table.
Source: https://data.giss.nasa.gov/gistemp/graphs_v3/
Graph: https://data.giss.nasa.gov/gistemp/graphs_v3/Fig.A3.gif
Annual Mean Temperature Change for Three Latitude Bands
Annual and five-year running mean temperature changes, with the base period 1951-1980, for three latitude bands that cover 30%, 40% and 30% of the global area. Uncertainty bars (95% confidence limits) are based on spatial sampling analysis. [This is an update of Figure 5 in Hansen et al. (1999).]
Figure also available as PDF, or Postscript, Also available is a table.
Source: https://data.giss.nasa.gov/gistemp/graphs_v3/
Graph: https://data.giss.nasa.gov/gistemp/graphs_v3/Fig.B.gif
Sea Surface Temperature (SST)
https://www.ospo.noaa.gov/Products/ocean/sst/anomaly/index.html
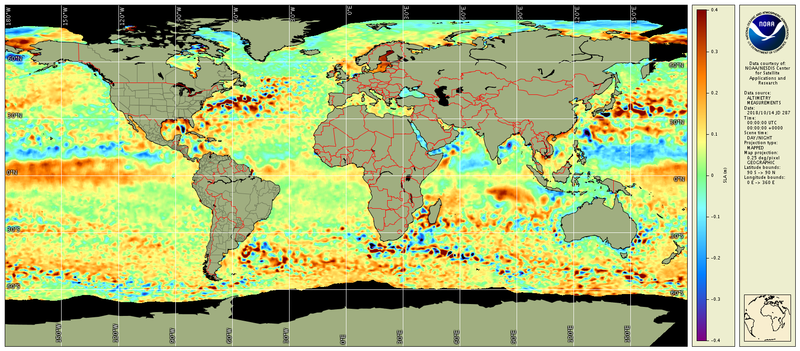
Sea Surface Height (SSH)
Land Ocean Temperature & Anomalies
Global Temperature (1-day average)
Upper Chart is Temperature
Lower Chart is Anomaly
Source: ESRL/NOAA
Global Surface Temperature (7-day average)
Upper Chart is Temperature
Lower Chart is Anomaly
Source: ESRL/NOAA
Global Surface Temperature (30-day average)
Upper Chart is Temperature
Lower Chart is Anomaly
Source: ESRL/NOAA
Global Surface Temperature (90-day average)
Upper Chart is Temperature
Lower Chart is Anomaly
Source: NOAA Earth System Research Laboratory
United States
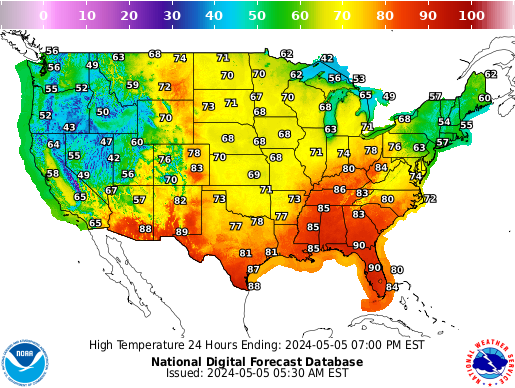
Source: NOAA/NWS (National Weather Service)