
Land, Fire & Ice
- Contents
| Note: Missing graphics may be due to temporary server maintenance (or the occasional gov. shutdown). |
LAND
Global Fire Maps 10 Day
Fire Map: 10 Day Segments
Image updates approximately every 10 days and represents the previous 10 days (approximately) from the extracted data from the MODIS Rapid Response System Global Fire Maps :

Static links for latest firemaps: Dates 600×300 2048×1024 4096×2048 8192×4096
Source: https://rapidfire.sci.gsfc.nasa.gov/firemaps/
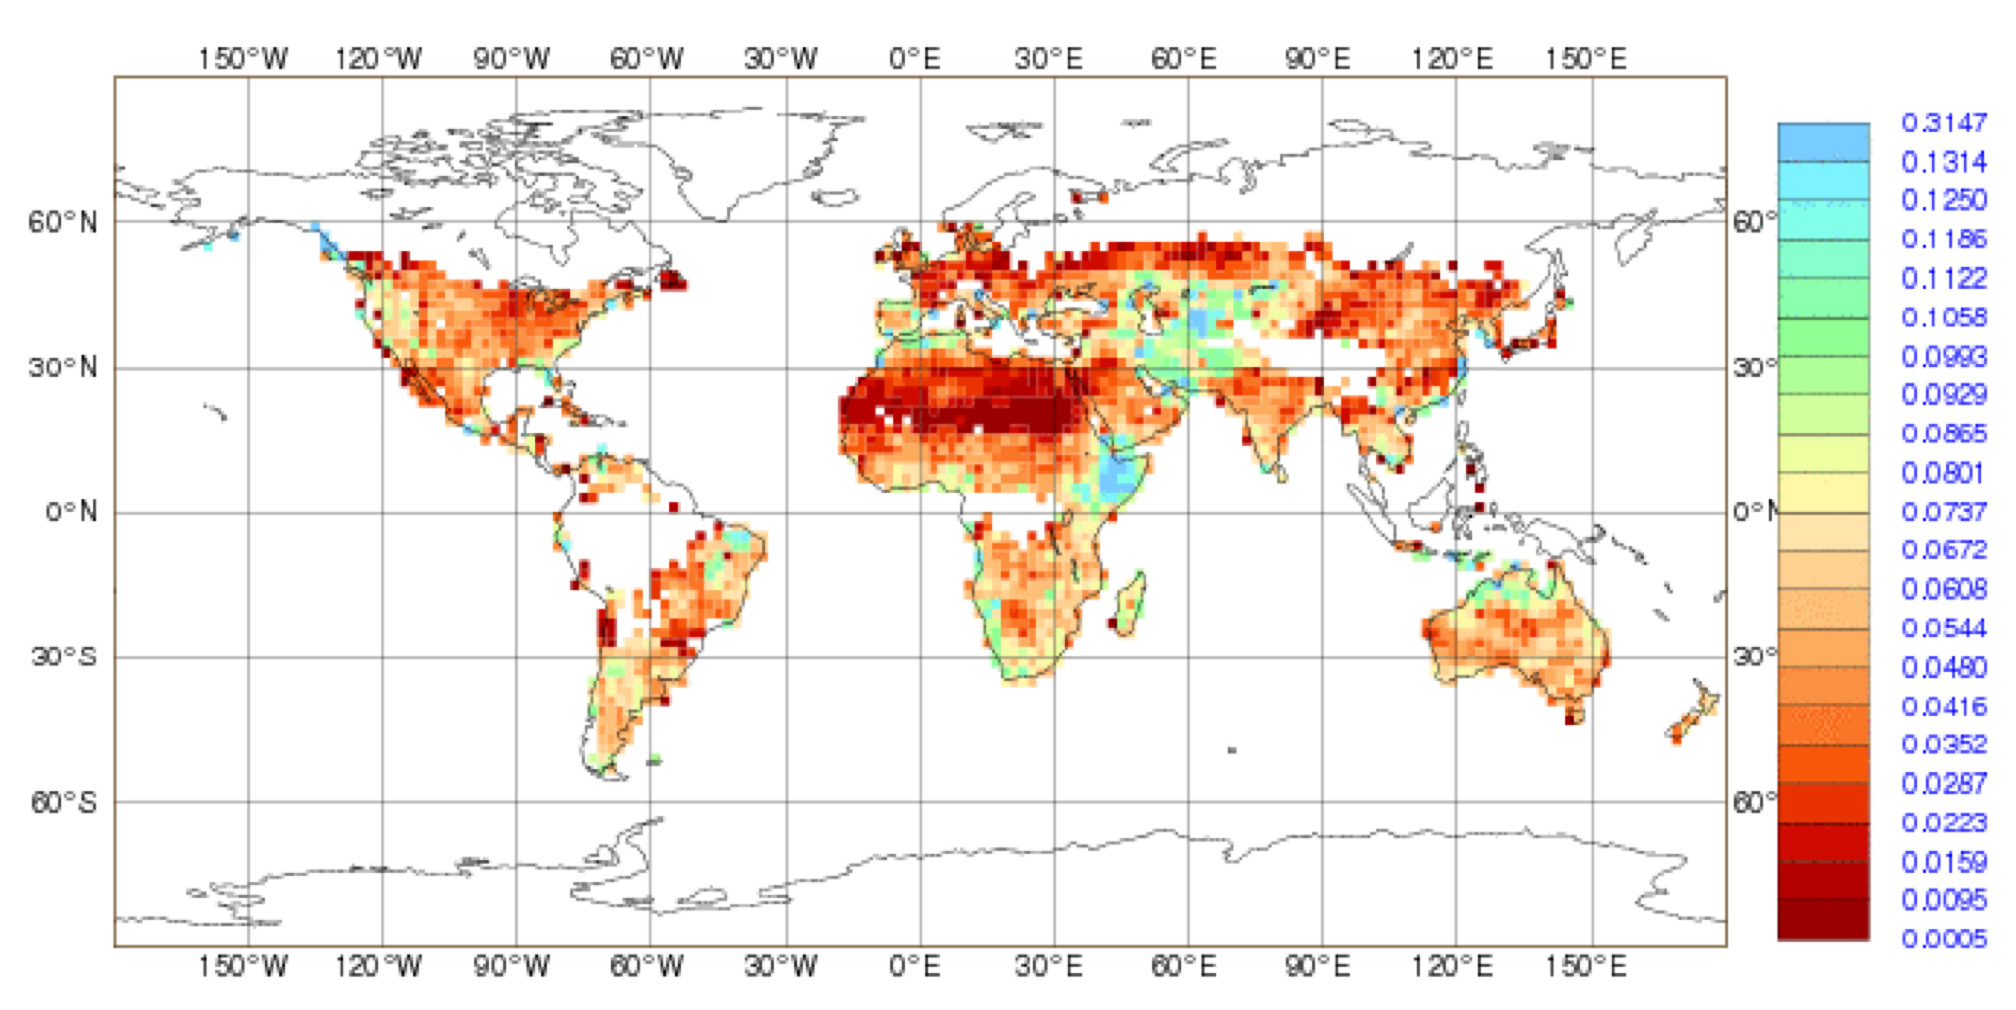
Vegetation Health Index
World , Vegetation Health Index (VHI): Current Week and One Year Ago |
|
|
VHI of current year |
|
Source: https://www.star.nesdis.noaa.gov/smcd/emb/vci/VH/vh_browseVH.php
Global Drought Monitoring
https://gdis-noaa.hub.arcgis.com/pages/drought-monitoring
https://spei.csic.es/map/maps.html
https://experience.arcgis.com/experience/5dceec104a384df094e65af12a274959/
Global Soil Moisture
This graph does not auto-update. For additional monthly charts click on the link below graphic.
|
Source: https://www.cpc.ncep.noaa.gov/products/Soilmst_Monitoring/gl_Soil-Moisture-Monthly.php
Global Near-Real-Time Monitoring of Soil Moisture
Operational monitoring of active and passive data gives information on systematic differences between model and satellite observations. The figure shows standard deviation of the difference between satellite observations and ECMWF model values for ASCAT soil moisture (m3.m-3).
Source: https://smap.jpl.nasa.gov/resources/34/global-near-real-time-monitoring-of-soil-moisture/
Snow Cover
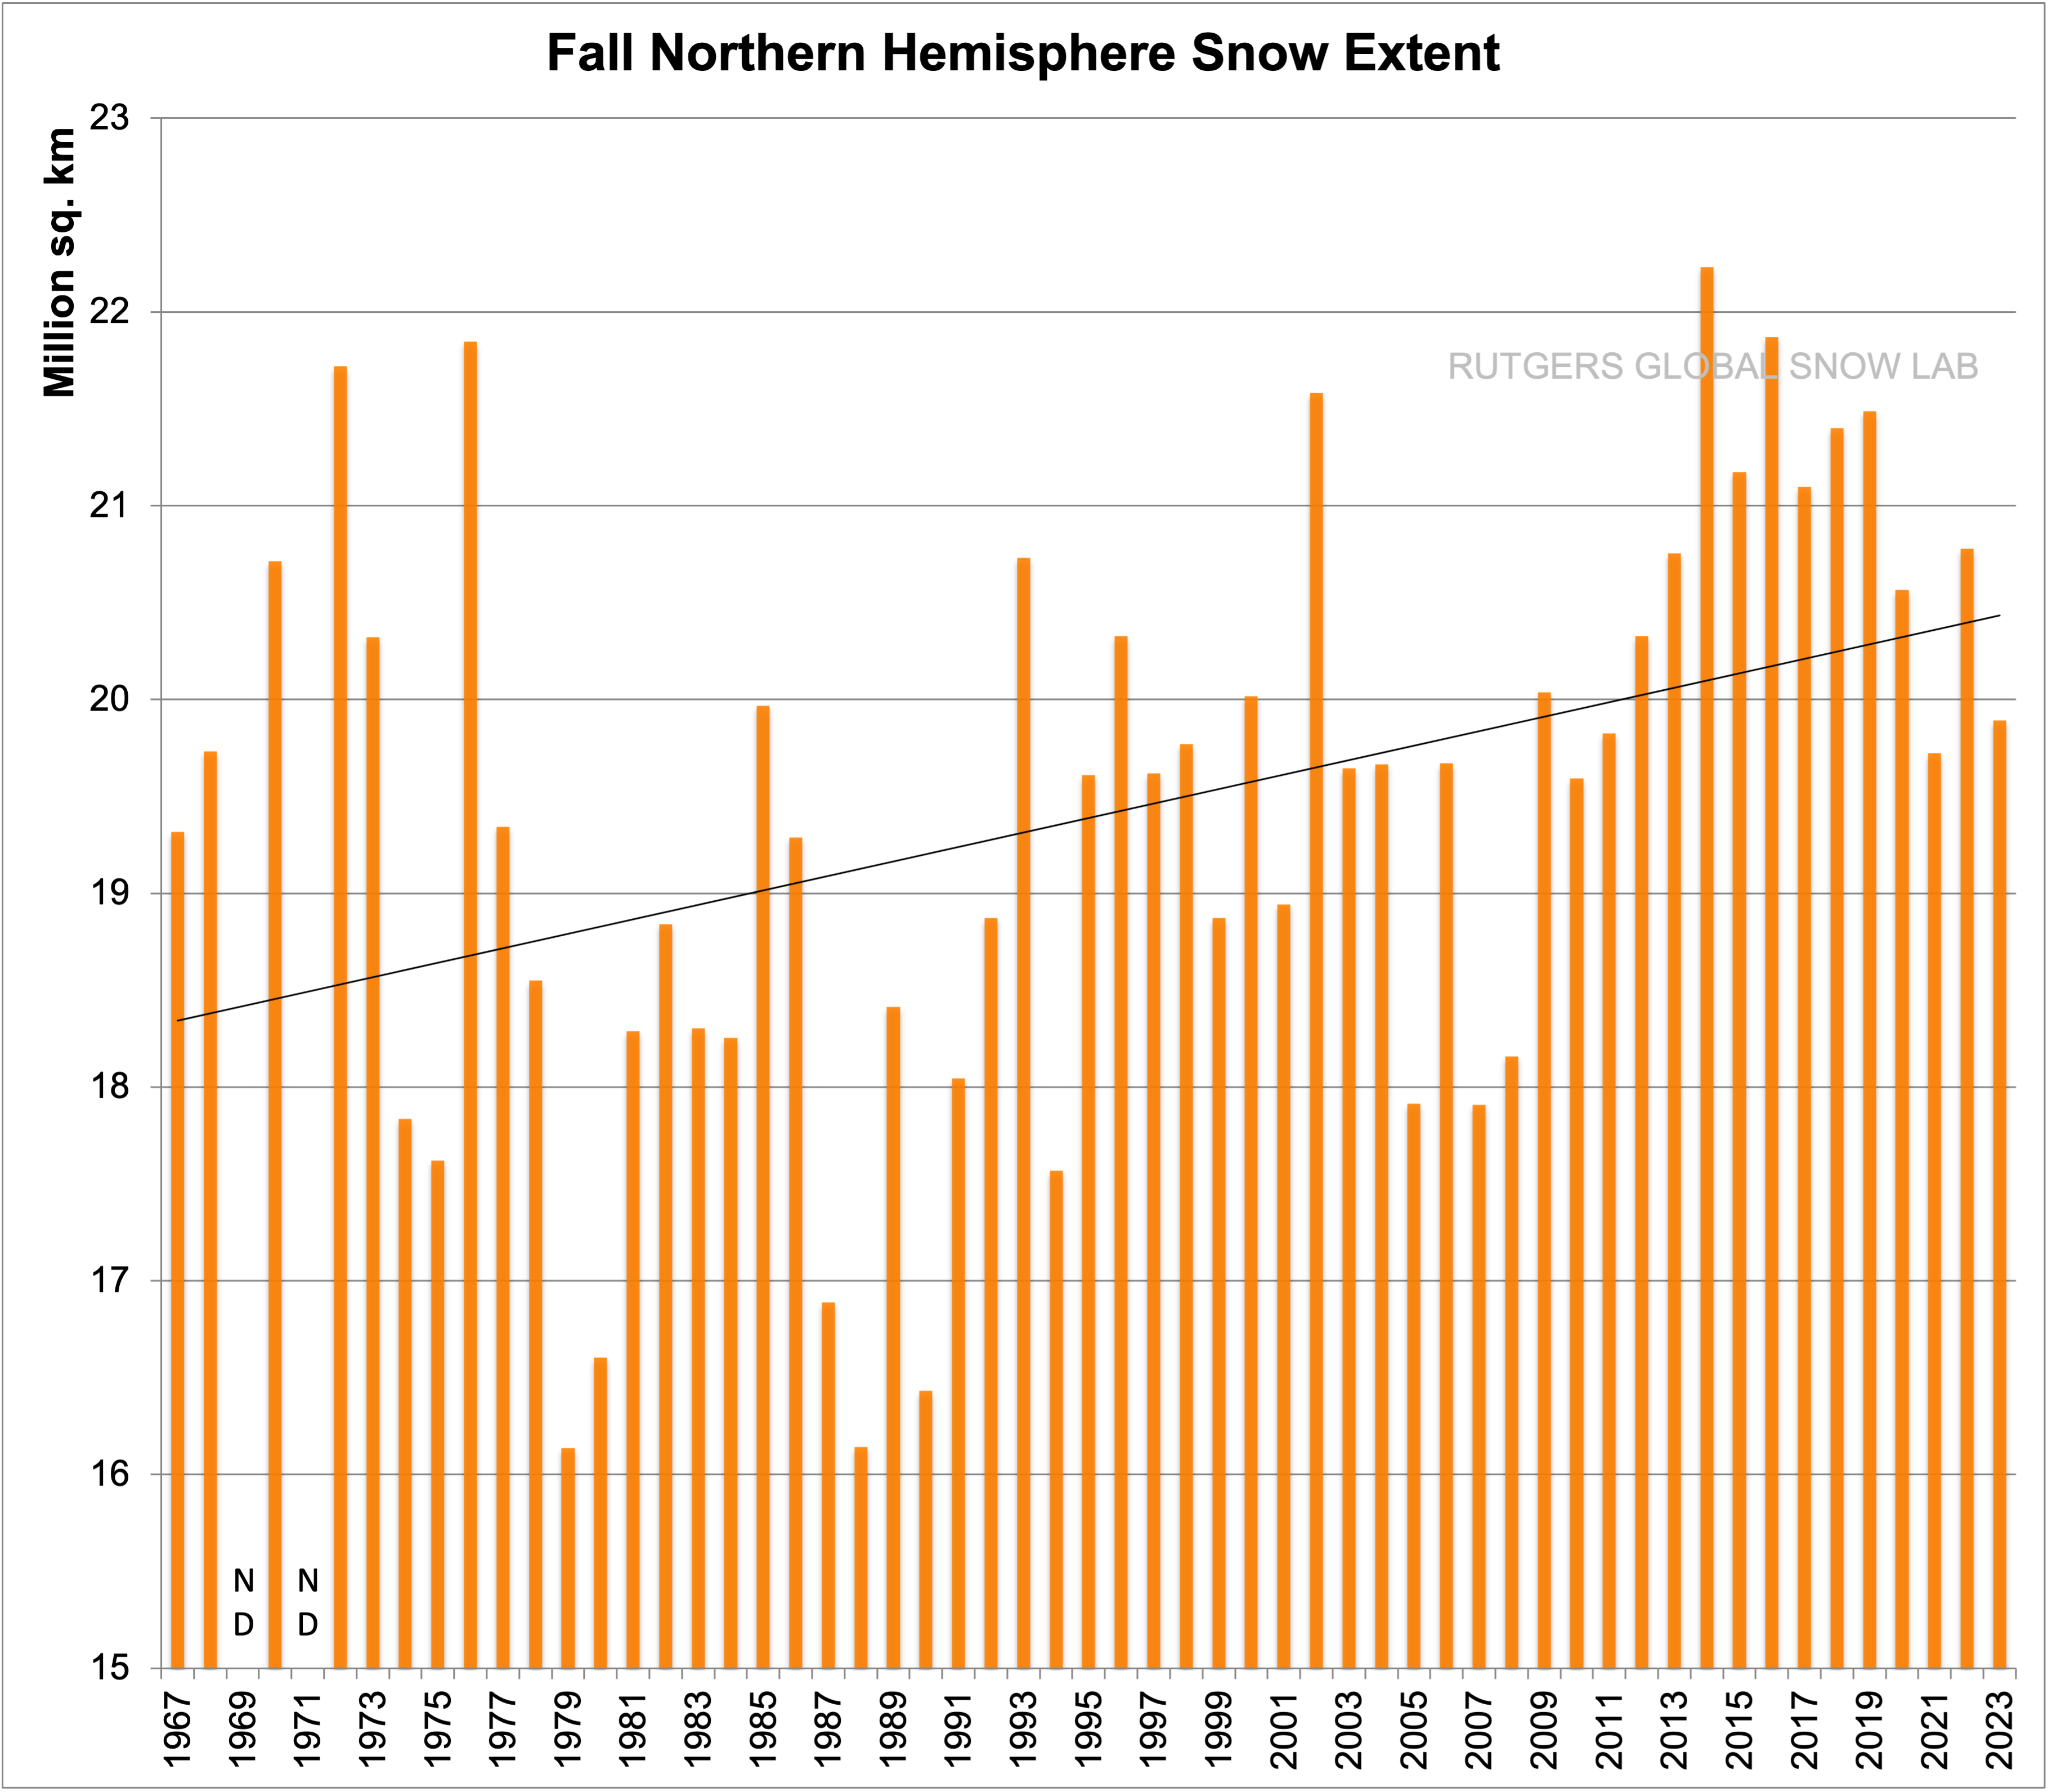
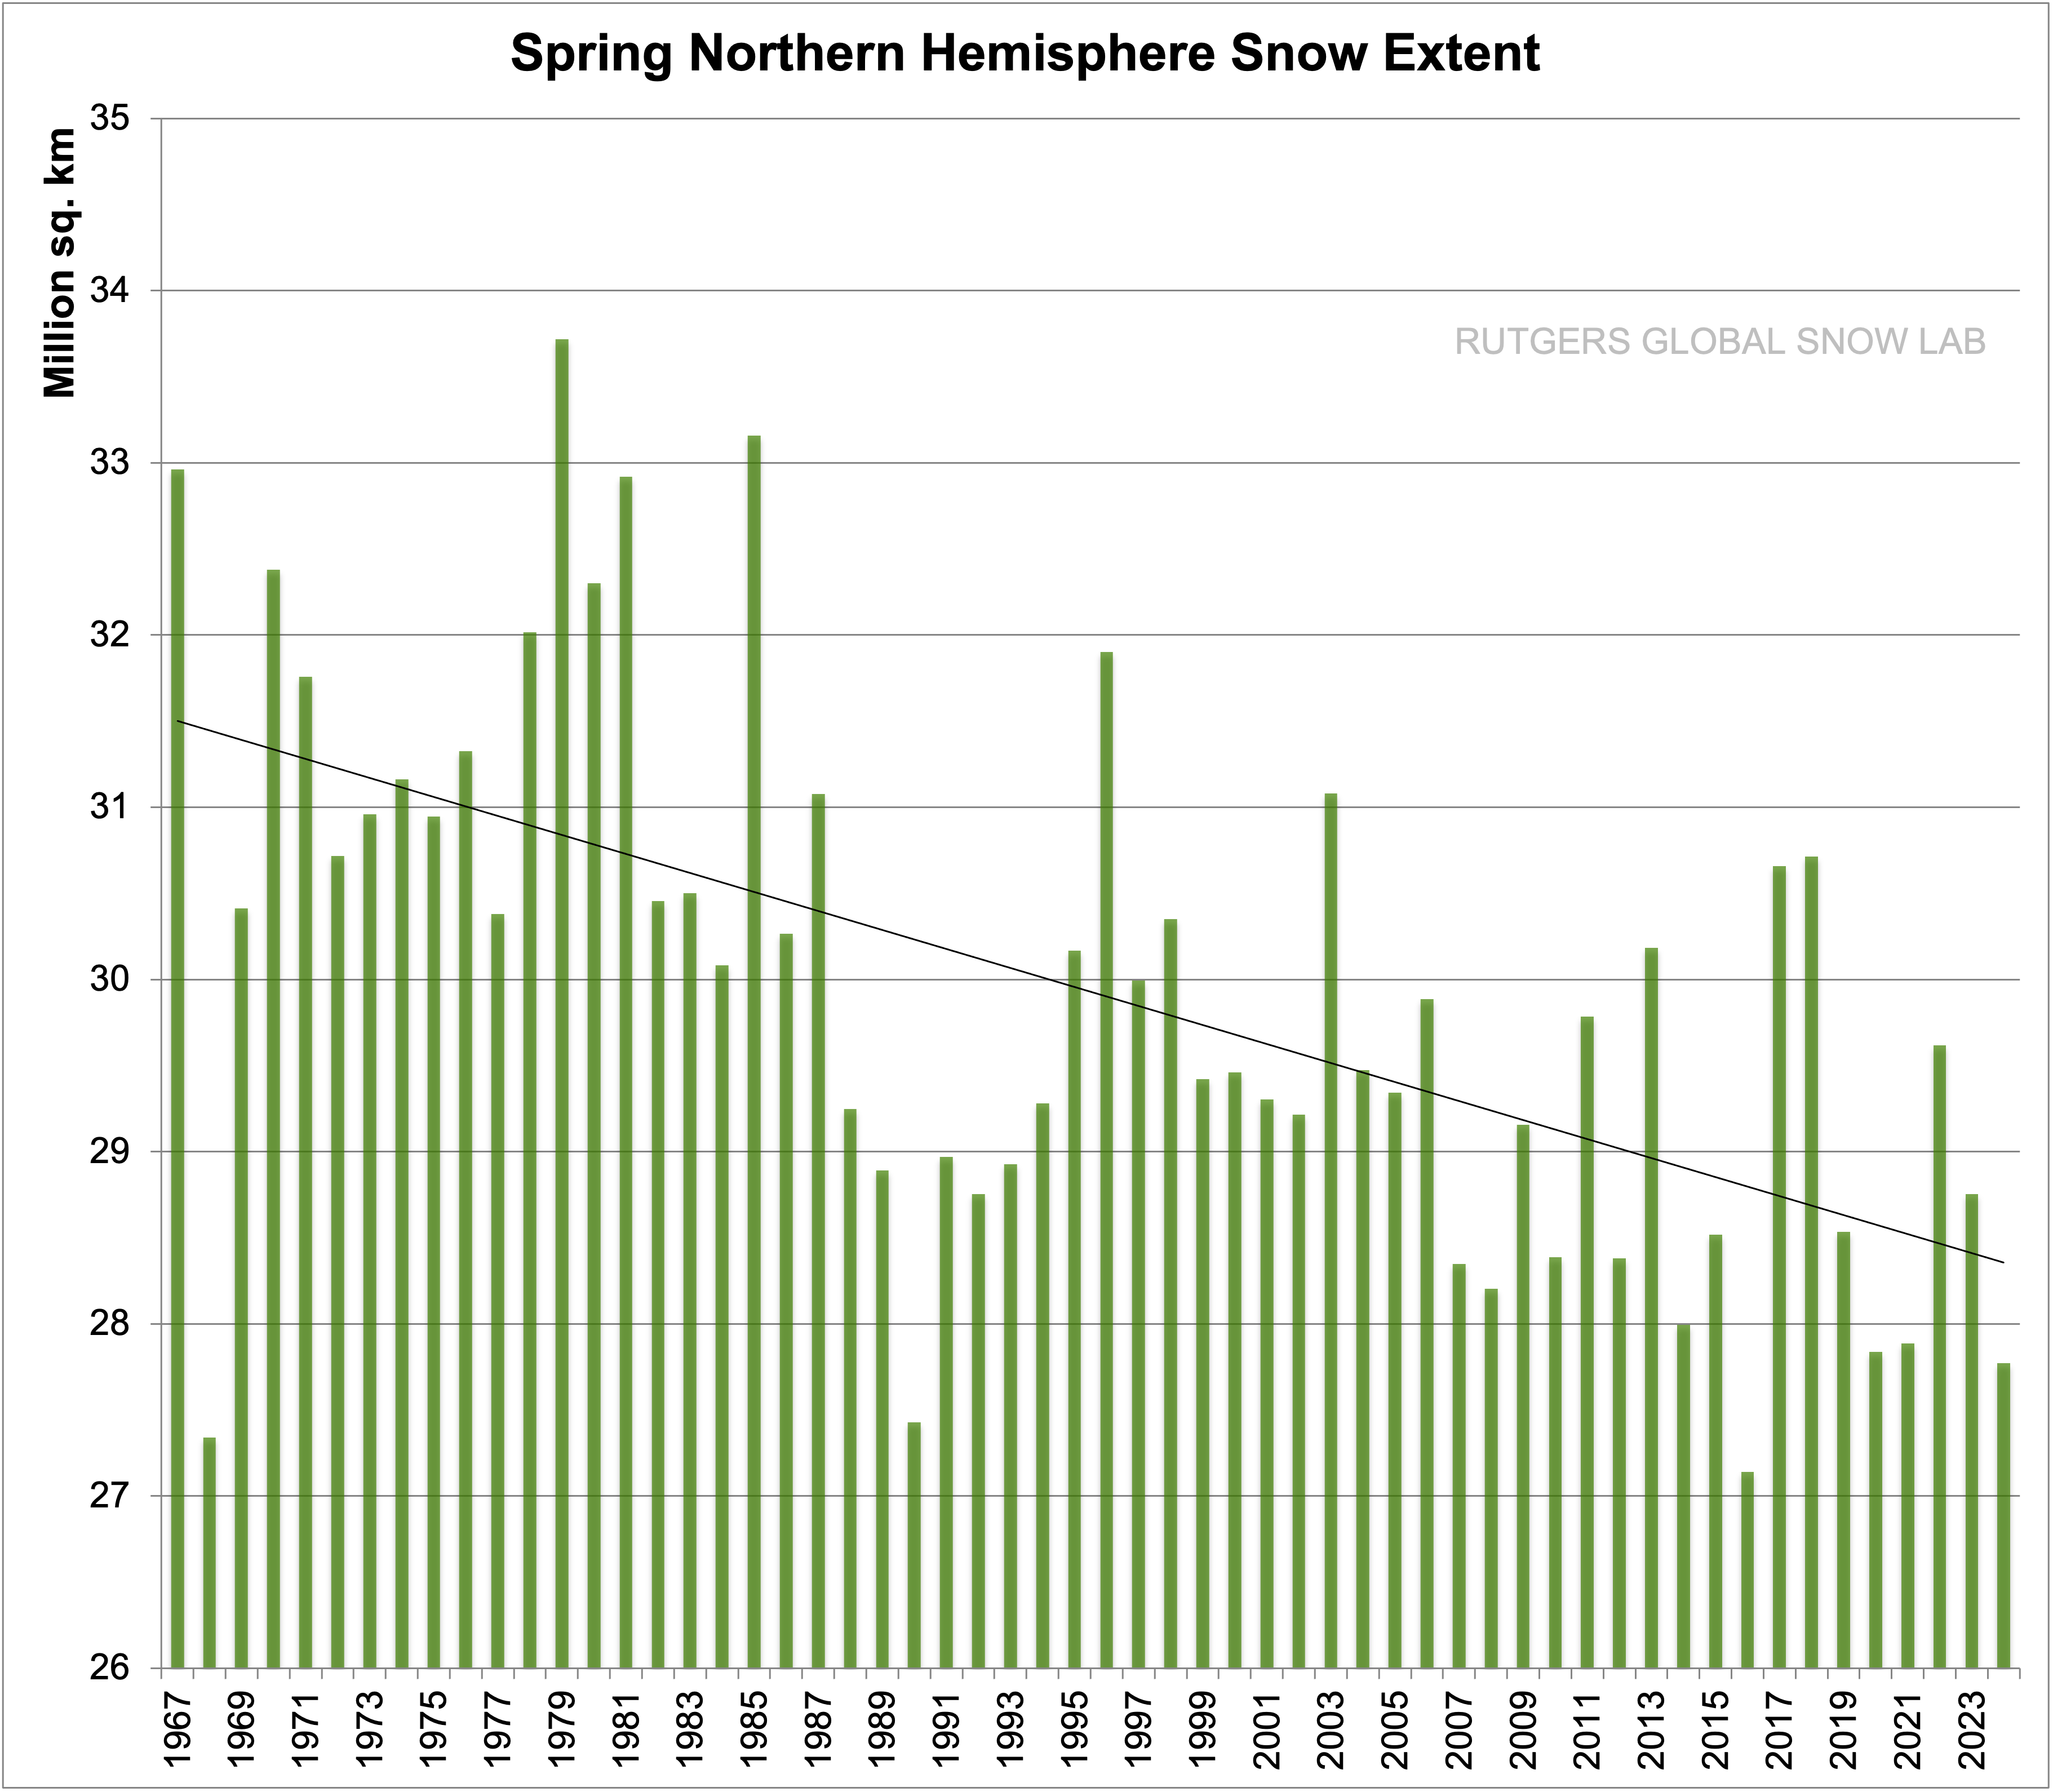
Note: Global warming is increasing the moisture content of the atmosphere due to warmer oceans. This could manifest as an increase in snow extent. The warmer atmospheric temperatures altering season lengths should melt the snow faster in the spring. The data does indicate this to be true. We will add to this section if direct attribution studies are conducted.
Fall Northern Hemisphere Snow Extent
As of 2012
Current Comparison
Source: https://climate.rutgers.edu/snowcover/
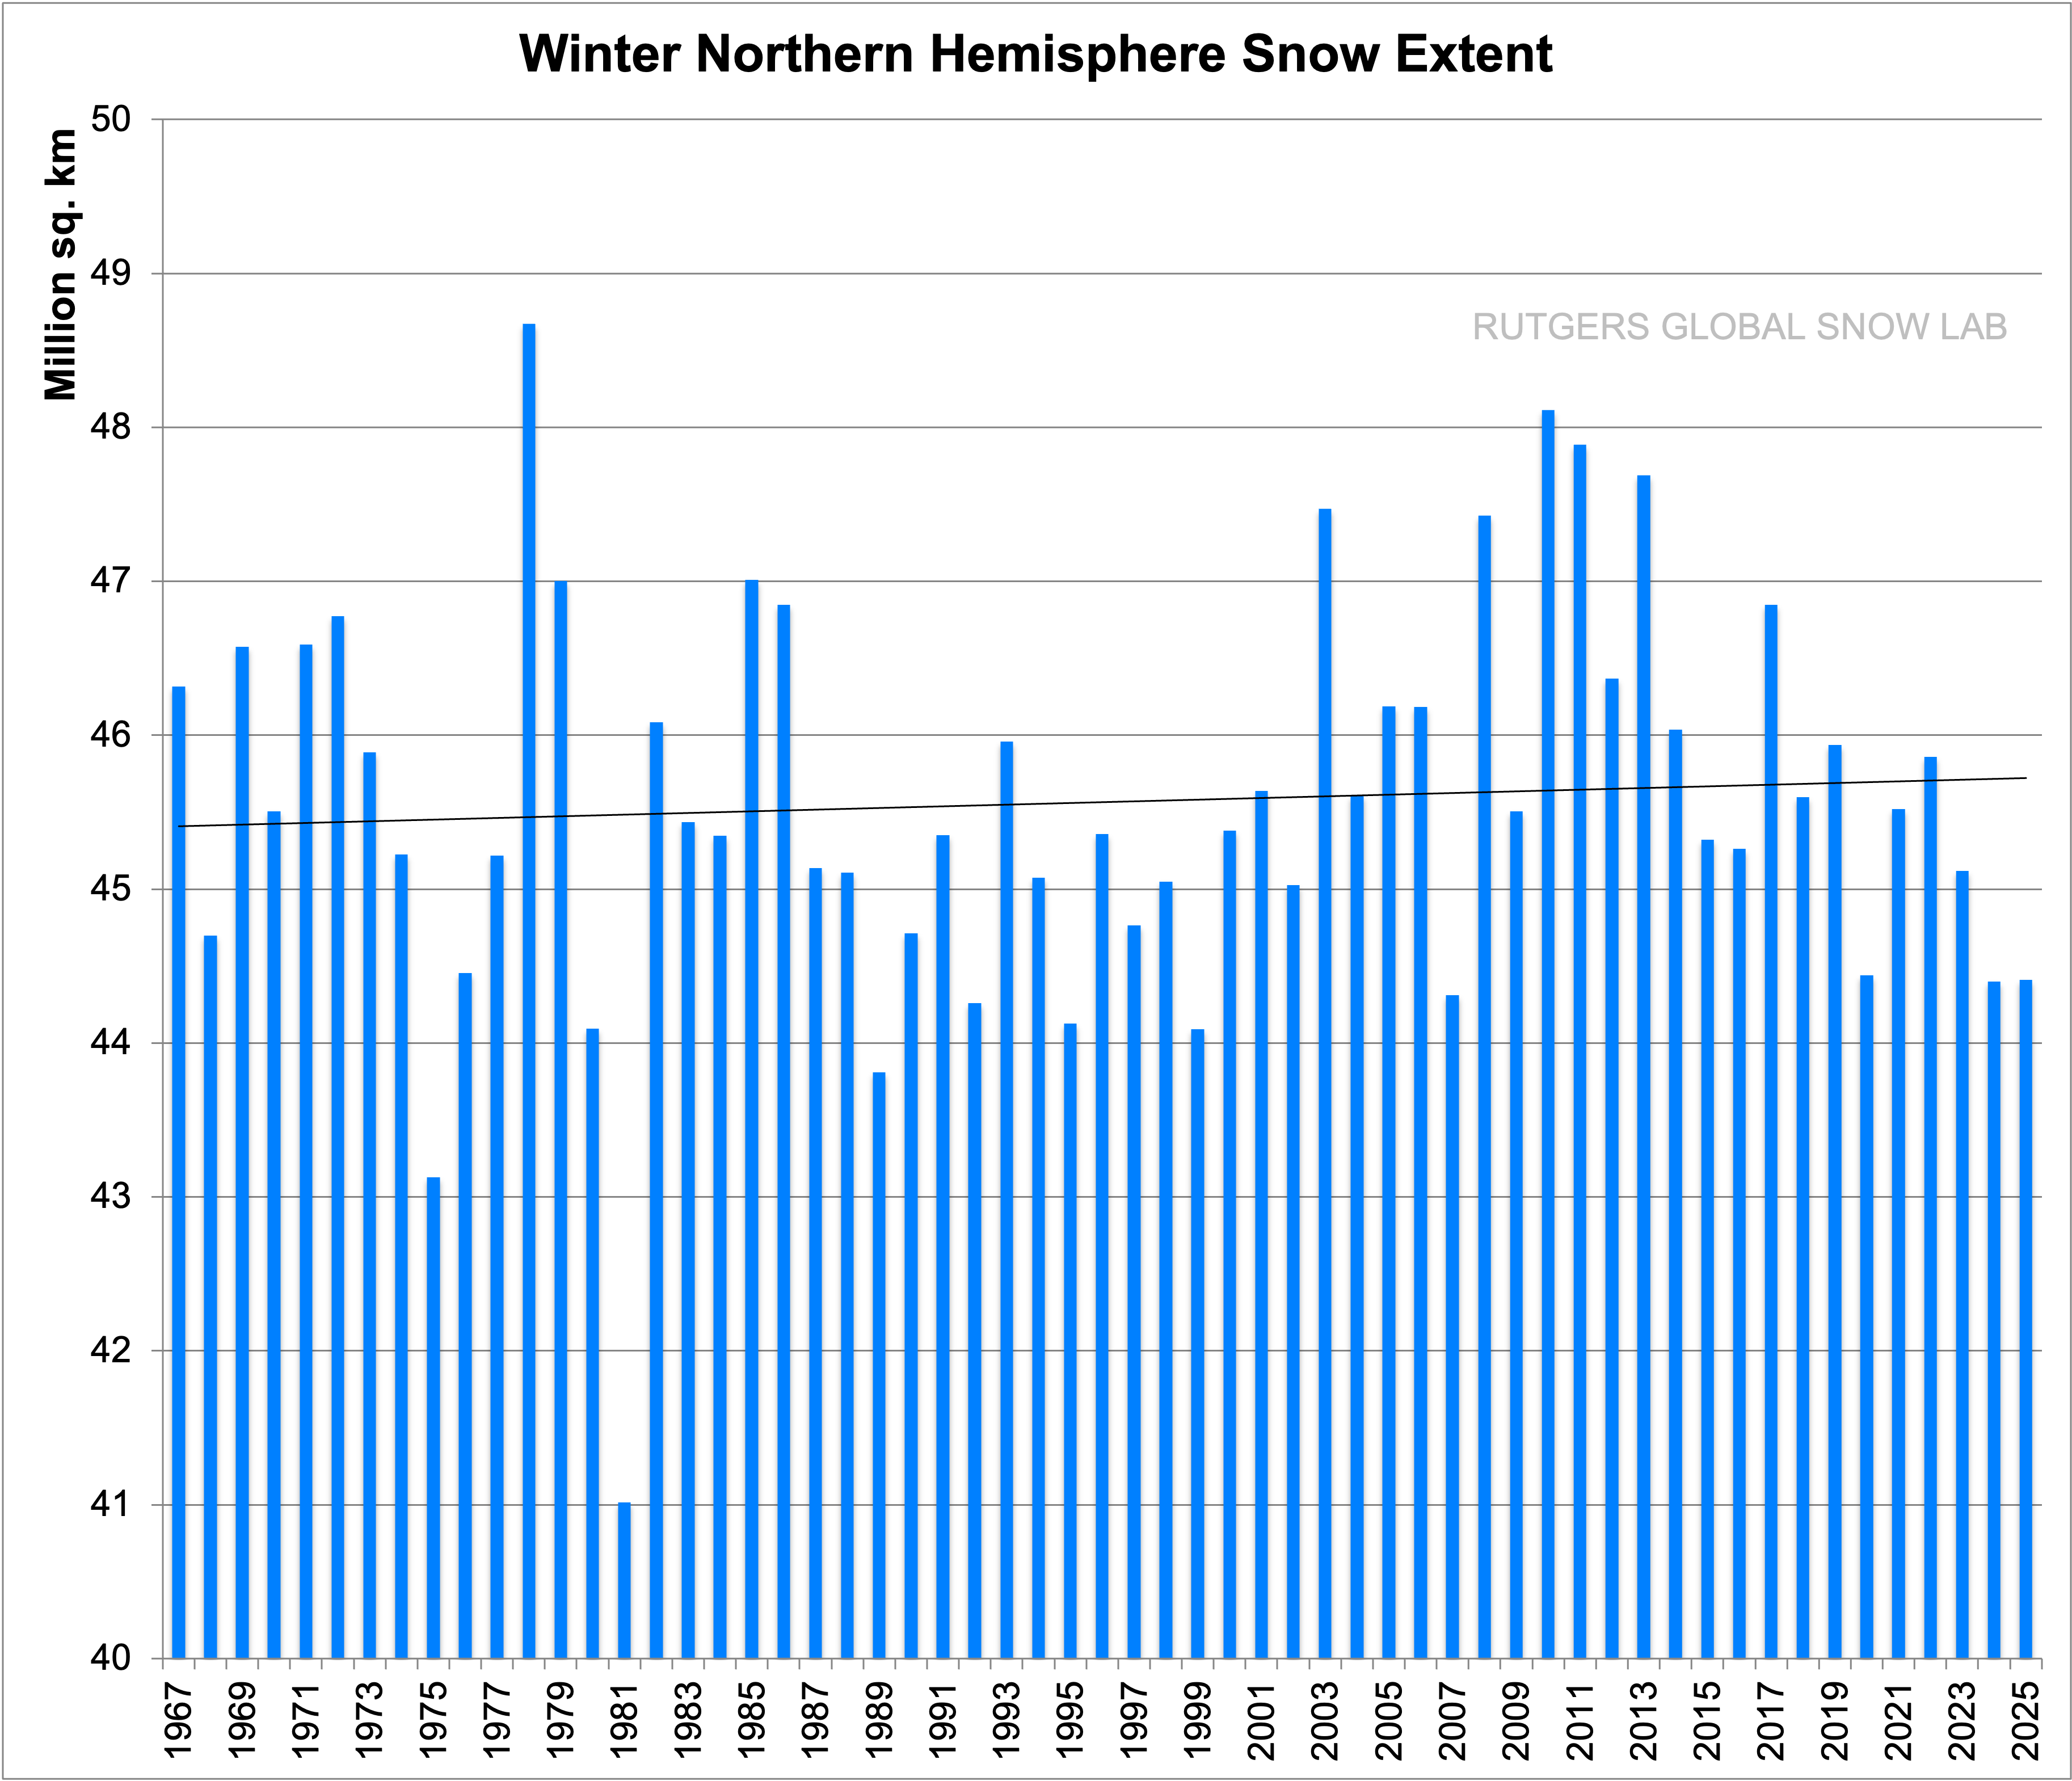
Winter Northern Hemisphere Snow Extent
As of 2012
Spring Northern Hemisphere Snow Extent
As of 2012