
Solar
- Contents
-
- Solar Influence
- What the Sun Looks Like Now
- Sunspots, Monthly Values, & the 10.7cm Radio Flux
- Solar Dynamics Observatory Composite Image – AIA Composite 211, 193, 171
- AIA 304
- AIA 4500 (Latest Sunspot Solar Image)
- Latest EUVI AIA 195 Images
- AIA 171
- Magnetogram
- AIA Composite 304 211 171
- Active Solar Regions
- Sunspot Number Progression
- F10.7cm Radio Flux Progression
- ISES Solar Cycle Ap Progression
- Latest Lyra Curve
- Auroral Activity Extrapolated from NOAA POES
- STATION K AND A INDICES
- Estimated 3-hour Planetary K-Index.
- Predicted Geomagnetic Activity Index using Wing Kp Model — 12-hour Plot
- Predicted Geomagnetic Activity Index using Wing Kp Model — 24-hour Plot
- Predicted Geomagnetic Activity Index using Wing Kp Model — 7-day Plot
- USGS Magnetometer
- 6 Hour X-Ray Flux
- 3 Day X-Ray Flux (5 Minute data)
- Proton Flux (5 Minute data)
- Electron Flux (5 minute data)
- Magnetometer (1 minute data)
- Links
- Sunspots, Monthly Values, & the 10.7cm Radio Flux
| Note: Missing graphics may be due to temporary server maintenance (or the occasional gov. shutdown). |
Solar Influence
The National Academy of Sciences, National Research Council, Board on Atmospheric Science and Climate Present ‘Climate Change: Lines of Evidence – Solar Influence’
What the Sun Looks Like Now
Sunspots, Monthly Values, & the 10.7cm Radio Flux
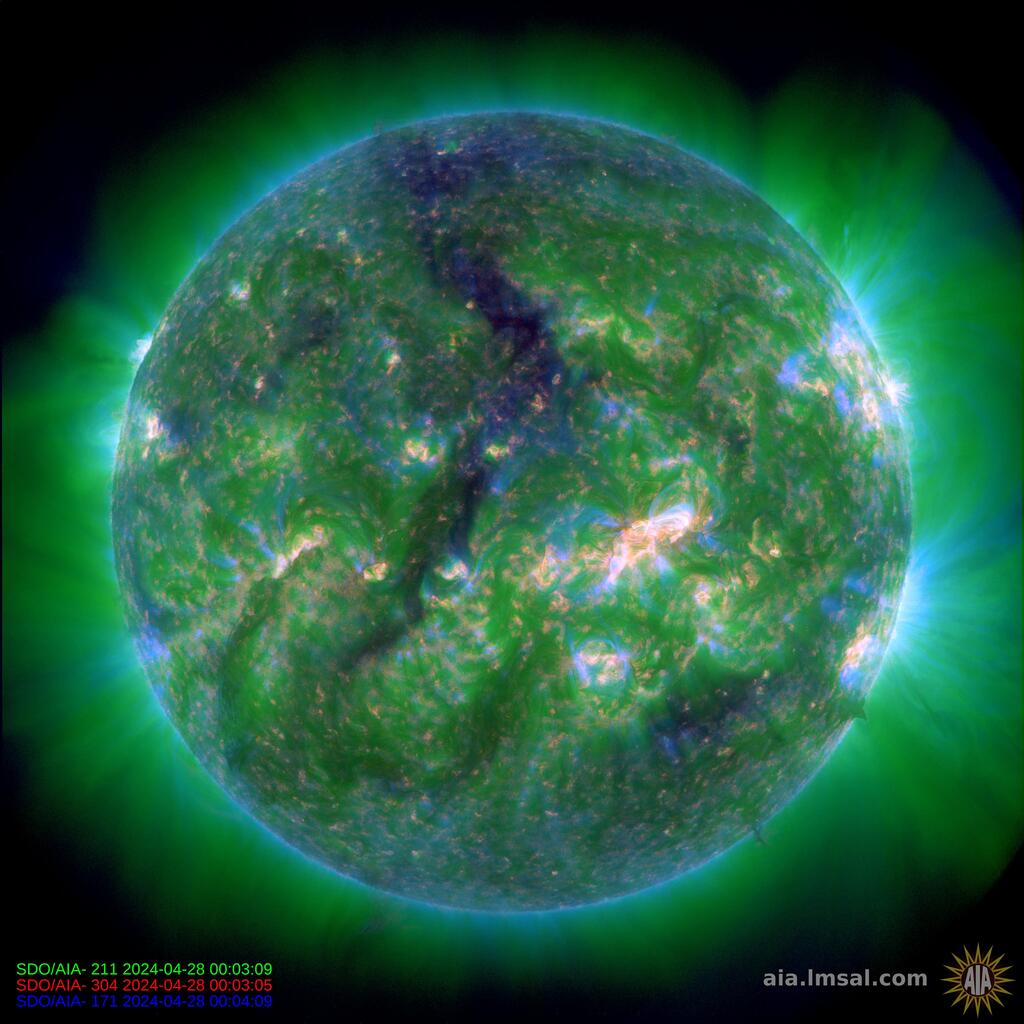
Solar Dynamics Observatory Composite Image – AIA Composite 211, 193, 171
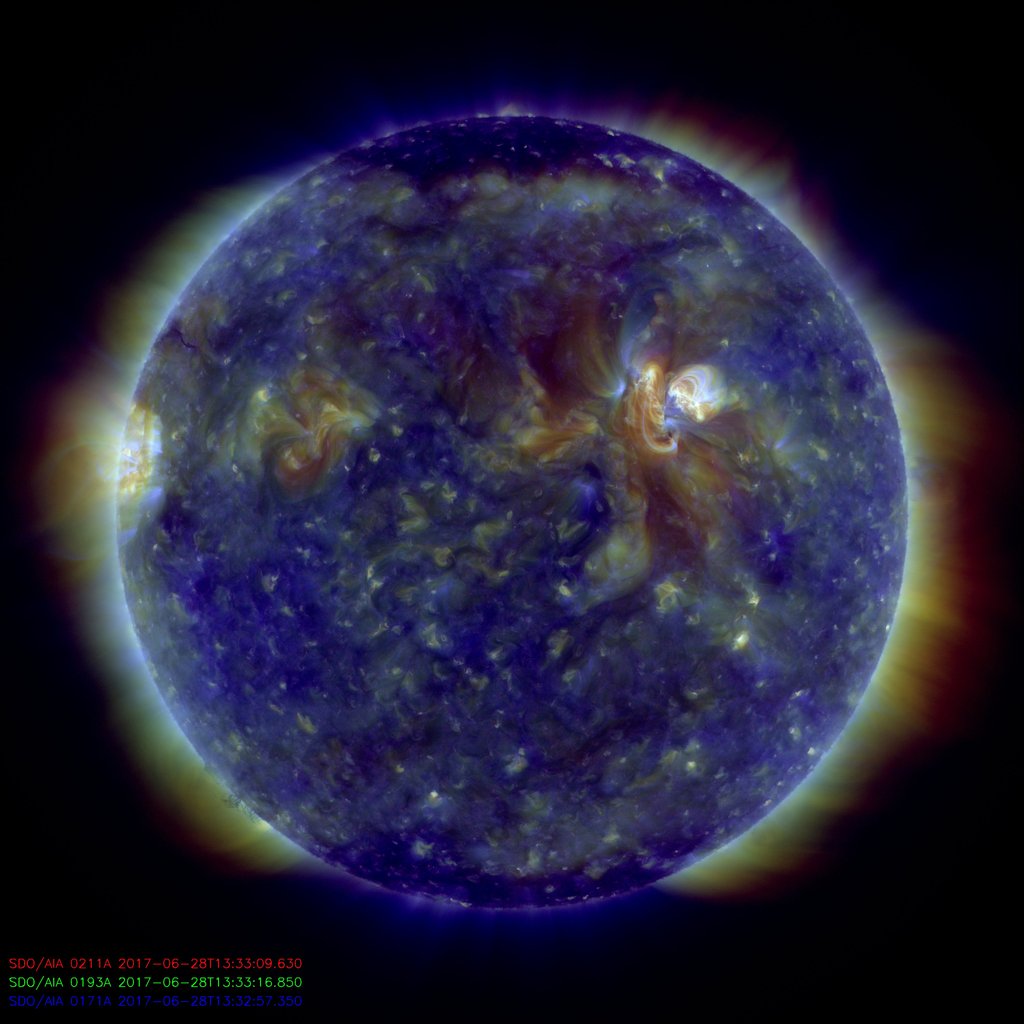
Source Image: https://sdo.gsfc.nasa.gov/assets/img/latest/f_211_193_171_1024.jpg
Source Site Link: https://sdo.gsfc.nasa.gov/
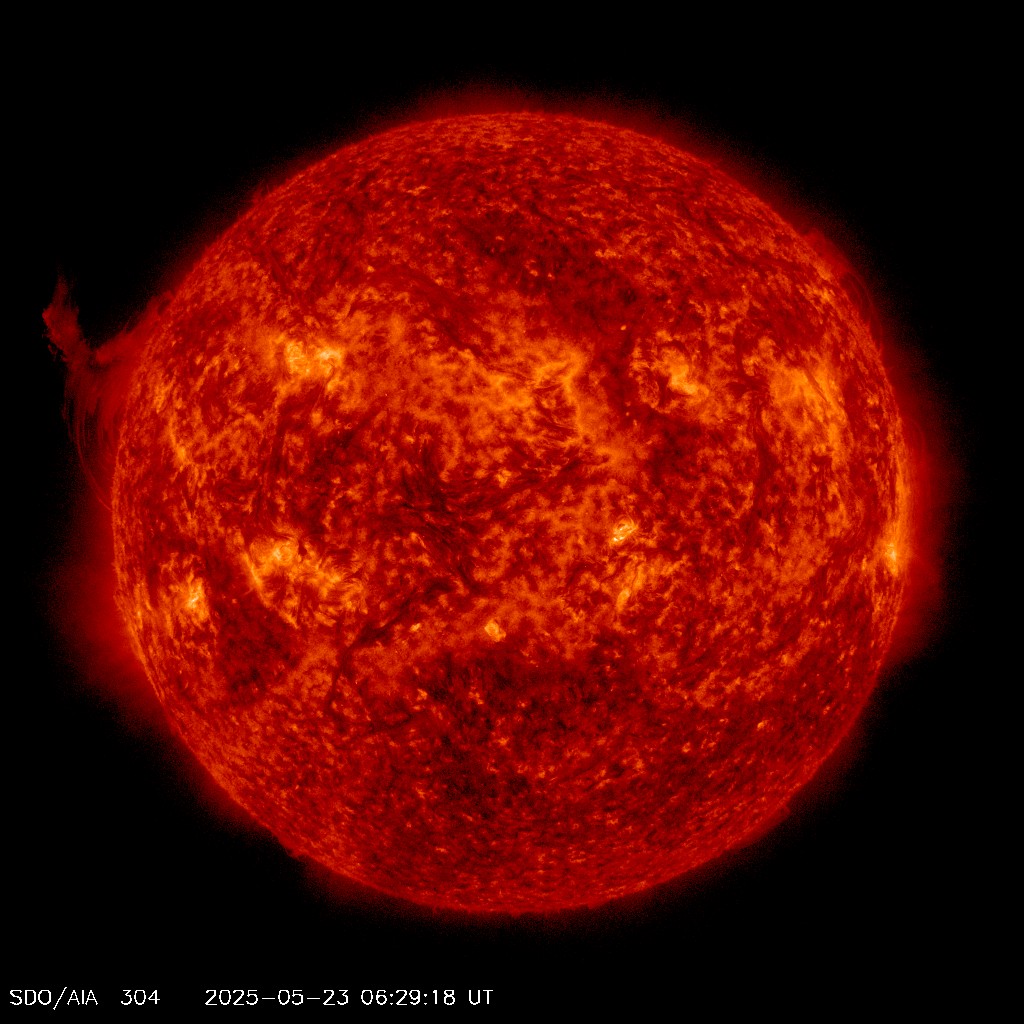
AIA 304
AIA 4500 (Latest Sunspot Solar Image)
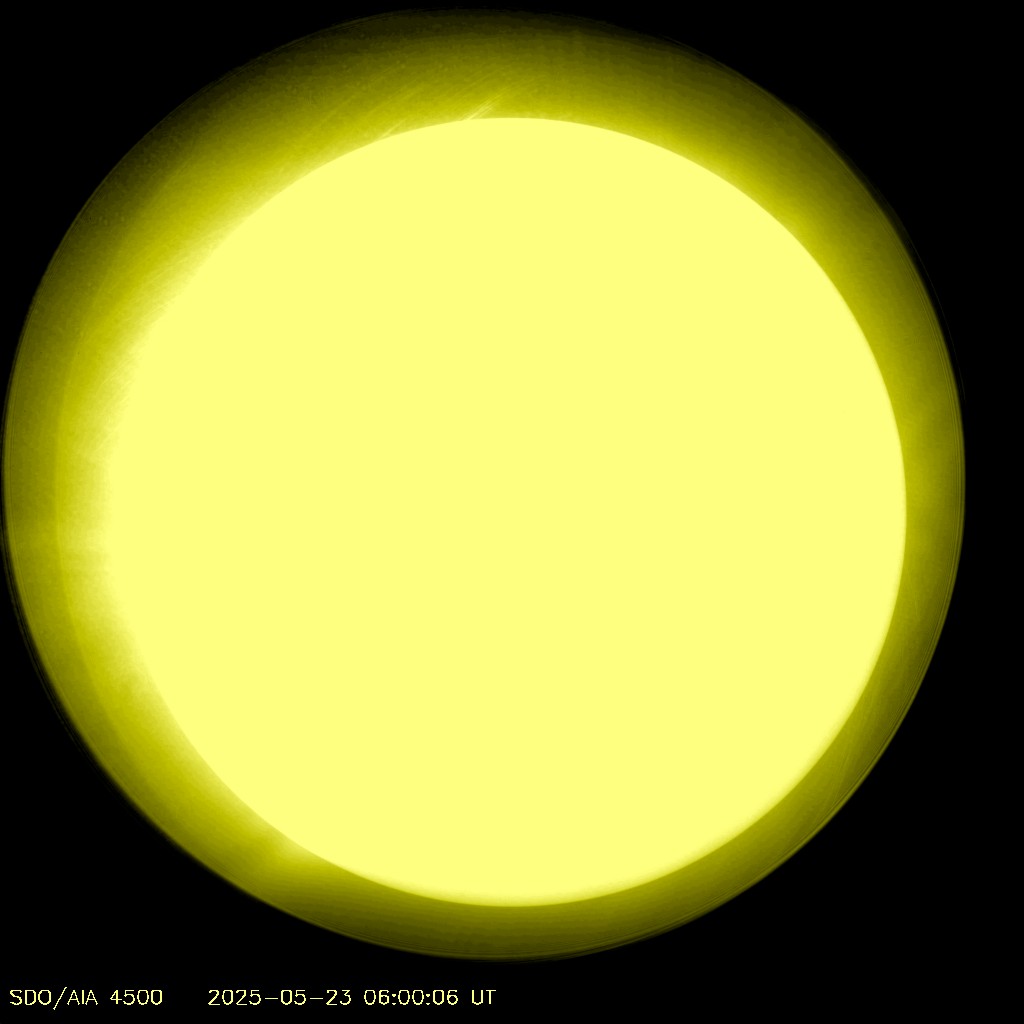
Image: https://sdo.gsfc.nasa.gov/assets/img/latest/latest_1024_4500.jpg
Source: https://sdo.gsfc.nasa.gov/data/
Latest EUVI AIA 195 Images

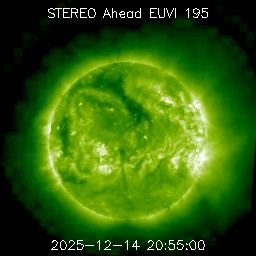
Source: https://stereo.gsfc.nasa.gov/
AIA 171

Image: https://sdo.gsfc.nasa.gov/assets/img/latest/latest_1024_0171.jpg
Source: https://sdo.gsfc.nasa.gov/
Magnetogram
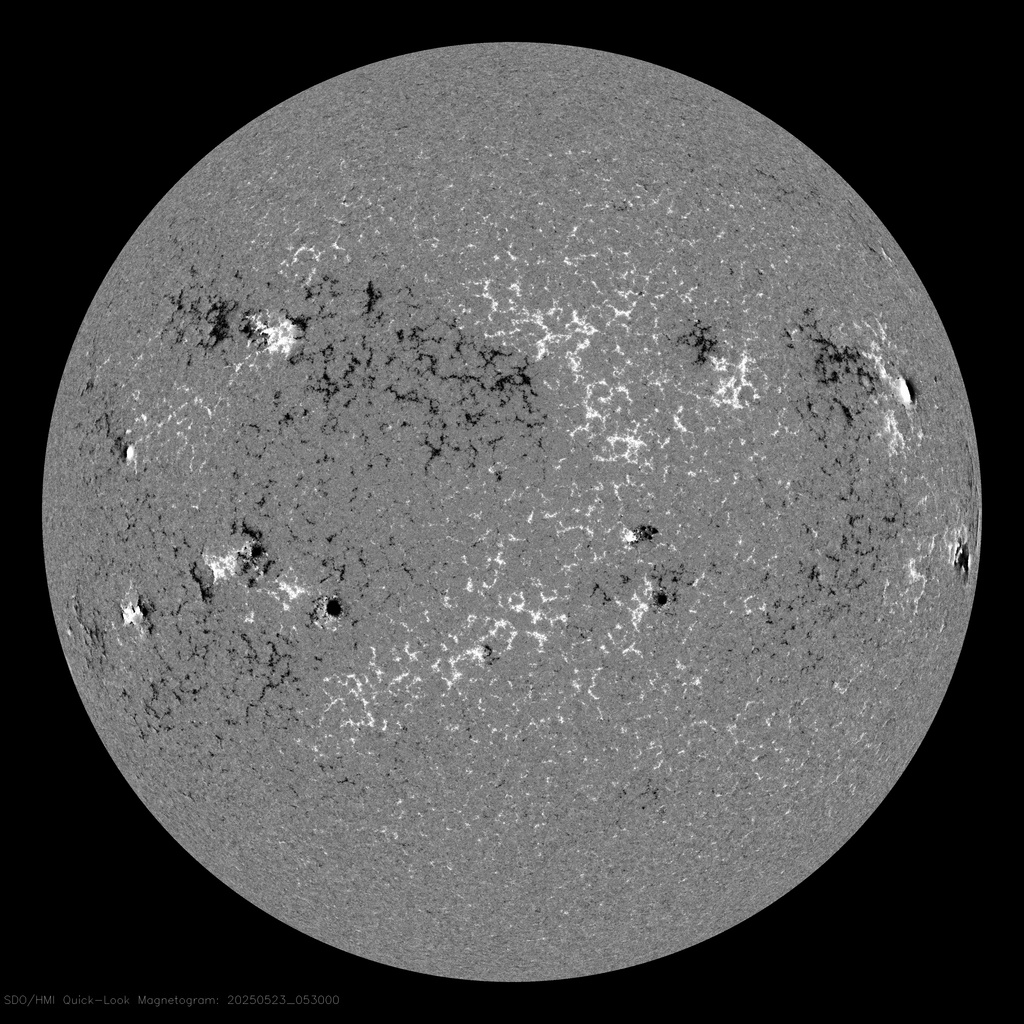
Source: https://sdo.gsfc.nasa.gov/assets/img/latest/latest_1024_HMIB.jpg
AIA Composite 304 211 171
Source: https://sdo.gsfc.nasa.gov/assets/img/latest/f_304_211_171_1024.jpg
Active Solar Regions
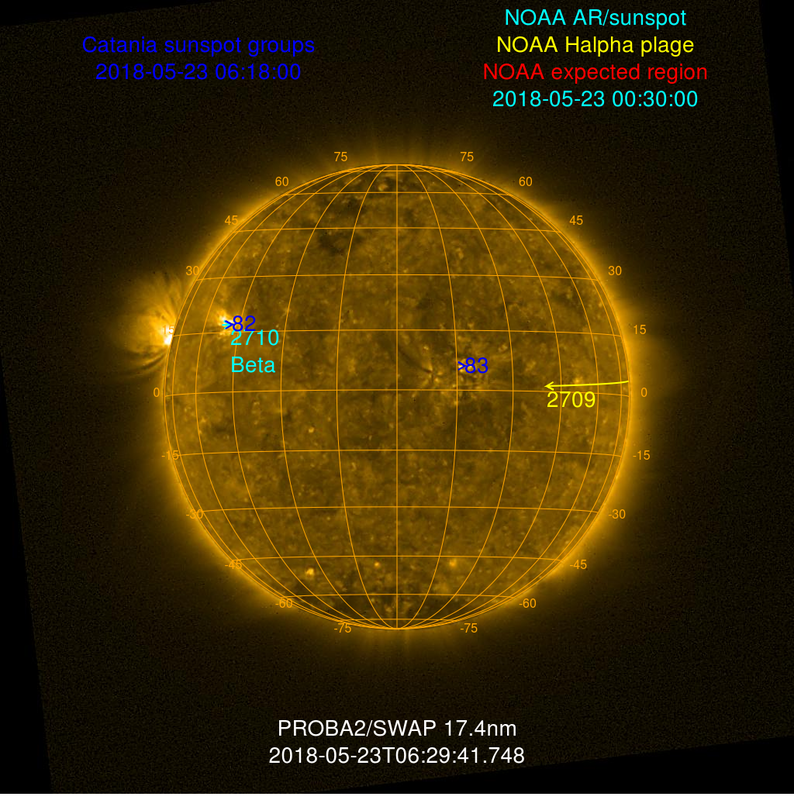
Image: https://sidc.oma.be/images/combimap800.png
Source: https://sidc.oma.be
Sunspot Number Progression
Source: https://www.swpc.noaa.gov/products/solar-cycle-progression
F10.7cm Radio Flux Progression

Source: https://www.swpc.noaa.gov/products/solar-cycle-progression
ISES Solar Cycle Ap Progression

Source: https://www.swpc.noaa.gov/products/solar-cycle-progression
Latest Lyra Curve

Image: https://solwww.oma.be/users/dammasch/LyraCalSWClatest.gif
Auroral Activity Extrapolated from NOAA POES
Northern Hemisphere
South Pole


Source: Space Weather Prediction Center: https://www.swpc.noaa.gov/pmap/
STATION K AND A INDICES
Station K Indices

https://legacy-www.swpc.noaa.gov/alerts/k-index.html
Station A Indices

https://legacy-www.swpc.noaa.gov/alerts/a-index.html
Source: https://www.swpc.noaa.gov/products/station-k-and-indices
Estimated 3-hour Planetary K-Index.
(Storm-level geomagnetic activity is indicated by levels of five or higher)

Source: https://www.swpc.noaa.gov/products/planetary-k-index
Predicted Geomagnetic Activity Index using Wing Kp Model — 12-hour Plot
[updates every 15 minutes]

12-hour Plot — 24-hour Plot — 7 Day Model Performance
Source: https://www.swpc.noaa.gov/wingkp/
Predicted Geomagnetic Activity Index using Wing Kp Model — 24-hour Plot
[updates every 15 minutes]

12-hour Plot — 24-hour Plot — 7 Day Model Performance
Predicted Geomagnetic Activity Index using Wing Kp Model — 7-day Plot

12-hour Plot — 24-hour Plot — 7 Day Model Performance
Source: https://www.swpc.noaa.gov/products/wing-kp
USGS Magnetometer

Source: https://www.swpc.noaa.gov/products/boulder-magnetometer
6 Hour X-Ray Flux

Source: https://legacy-www.swpc.noaa.gov/rt_plots/xray_1m.html
3 Day X-Ray Flux (5 Minute data)

Source: https://www.swpc.noaa.gov/products/goes-electron-flux
Proton Flux (5 Minute data)

Source: https://www.swpc.noaa.gov/products/goes-proton-flux
Electron Flux (5 minute data)
Source: https://www.swpc.noaa.gov/products/goes-electron-flux
Magnetometer (1 minute data)

Source: https://www.swpc.noaa.gov/products/goes-magnetometer
Links
- Space Weather Prediction Center – https://www.swpc.noaa.gov/
- Goddard Space Flight Center – https://stereo.gsfc.nasa.gov/
- The Solar and Heliospheric Observatory – https://sohowww.nascom.nasa.gov/
- GSFC Solar Dynamics Observatory – https://sdo.gsfc.nasa.gov/data/
- https://www.nasa.gov/mission_pages/stereo/main/index.html
- https://stereo-ssc.nascom.nasa.gov/beacon/beacon_secchi.shtml